. 2023 Nov 6;20(11):5910-5920.
doi: 10.1021/acs.molpharmaceut.3c00755. Epub 2023 Oct 6.

Confocal Raman Spectroscopic Characterization of Dermatopharmacokinetics Ex Vivo

Affiliations

Confocal Raman Spectroscopic Characterization of Dermatopharmacokinetics Ex Vivo

Panagiota Zarmpi et al. Mol Pharm. .

Abstract

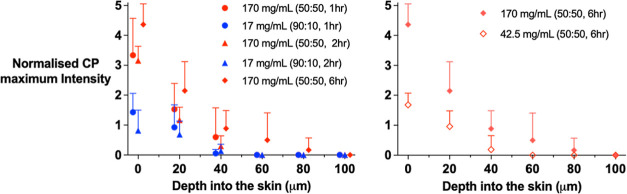
Confocal Raman spectroscopy is being assessed as a tool with which to quantify the rate and extent of drug uptake to and its clearance from target sites of action within the viable epidermis below the skin's stratum corneum (SC) barrier. The objective of this research was to confirm that Raman can interrogate drug disposition within the living layers of the skin (where many topical drugs elicit their pharmacological effects) and to identify procedures by which Raman signal attenuation with increasing skin depth may be corrected and normalized so that metrics descriptive of topical bioavailability may be identified. It was first shown in experiments on skin cross-sections parallel to the skin surface that the amide I signal, originating primarily from keratin, was quite constant with depth into the skin and could be used to correct for signal attenuation when confocal Raman data were acquired in a "top-down" fashion. Then, using 4-cyanophenol (CP) as a model skin penetrant with a strong Raman-active C≡N functionality, a series of uptake and clearance experiments, performed as a function of time, demonstrated clearly that normalized spectroscopic data were able to detect the penetrant to at least 40-80 μm into the skin and to distinguish the disposition of CP from different vehicles. Metrics related to local bioavailability (and potentially bioequivalence) included areas under the normalized C≡N signal versus depth profiles and elimination rate constants deduced post-removal of the formulations. Finally, Raman measurements were made with an approved dermatological drug, crisaborole, for which delivery from a fully saturated formulation into the skin layers just below the SC was detectable.

Keywords: Raman spectroscopy; skin clearance; skin penetration; skin uptake; topical bioavailability.


Conflict of interest statement

The authors declare no competing financial interest.

Figures

Figure 1
Figure 1
(a) Schematic of “top-down” and “cross-section” experiments. (b) Custom-built skin sample holder. SC = stratum corneum.
Figure 2
Figure 2
“Cross-section”, “top-down”, and corrected “top-down” maximum amide I signal intensities (for signal attenuation that increases with increasing depth into the skin, as described in the text) from untreated skin samples (left panel). The “top-down” and corrected for attenuation “top-down” data after application of different CP formulations for different times are shown in the central and right panels, respectively (some data points have been shifted on the x-axis to facilitate visualization). Data points represent the mean plus or minus the SD (from six different skin samples from a single pig).
Figure 3
Figure 3
Combined, maximum amide I signal intensities (geometric means with their 95% confidence intervals) at 1655 cm–1 measured “top-down” as a function of skin depth (i.e., the data in the left and central panels of Figure 2, for the untreated and treated samples, respectively) and the natural logarithmic transformation of the data (means with their 95% confidence intervals) described by eq 2. Data points are calculated from experiments using 42 different skin samples from a single pig.
Figure 4
Figure 4
Maximum amide I, CH2 bending, and CH3 stretching signal intensities (geometric means and 95% confidence intervals) at 1655, 1448, and 2937 cm–1, respectively, measured “top-down” as a function of skin depth (left panel); the natural logarithmic transformations of the data (means and 95% confidence intervals) described by eq 2 are shown in the right panel. Data points (some of which have been shifted on the x-axis to facilitate visualization) are the means from three different skin samples from one pig.
Figure 5
Figure 5
Normalized CP maximum intensity signal (eq 4) measured “top-down” as a function of skin depth following application of two fully saturated CP formulations in 50:50 or 90:10 v/v water/PG for 1, 2, or 6 h (left) and fully or 25% saturated CP formulations in 50:50 v/v water/PG for 6 h (right). Data points (some of which have been shifted on the x-axis to facilitate visualization) are the means (+SD) from six different skin samples from one pig.
Figure 6
Figure 6
Upper panels: normalized CP maximum intensity signals as a function of skin depth at different clearance times, following the application of three CP formulations for 6 h. Dashed curves are simple connection lines between points. Lower panels: normalized CP maximum intensity signals as a function of clearance time at different depths into the skin, following application of the same three CP formulations again for 6 h. The lines are the best fits to an exponential decay function at each depth (for the cases when at least five non-zero average values were available). Some data points have been shifted on the x-axis to facilitate visualization. In both panels, the data points are the mean + SD (from six different pieces of skin from a single pig). Note that the y-axis scales are different for the 170 mg mL–1 CP formulation.
Figure 7
Figure 7
Amide I and CP maximum Raman signal intensities, together with the normalized CP to amide I ratio, as a function of CP concentration in the lyophilized and rehydrated pig skin powder model. Data points are the mean ± SD (n = 3) of the average value of three measurements of each standard. The regression line through the data in the right panel has a slope of 0.044 mM–1 (95% confidence interval is 0.041–0.046), with r2 = 0.999.
Figure 8
Figure 8
Normalized “top-down” maximum signal intensity of the crisaborole C≡N vibration at 2230 cm–1 as a function of skin depth following the application of fully saturated and half-saturated formulations in propylene carbonate for 24 h. Data points (some of which have been shifted on the x-axis to facilitate visualization) represent the mean plus or minus SD from n = 6 different pieces of skin from a single pig.

Similar articles

Cited by

References

    1. Shah V. P.; Flynn G. L.; Yacobi A.; et al. Bioequivalence of Topical Dermatological Dosage Forms-Methods of Evaluation of Bioequivalence. Pharm. Res. 1998, 15, 167–171. 10.1023/a:1011941929495. - DOI - PubMed
    1. Guidance for Industry: Bioavailability and Bioequivalence Studies Submitted in NDAs or INDs — General Considerations. https://www.fda.gov/files/drugs/published/Bioavailability-and-Bioequival... (accessed 17 Jan, 2023).
    1. Raney S. G.; Franz T. J.; Lehman P. A.; Lionberger R.; Chen M. L. Pharmacokinetics-Based Approaches for Bioequivalence Evaluation of Topical Dermatological Drug Products. Clin. Pharmacokinet. 2015, 54, 1095–1106. 10.1007/s40262-015-0292-0. - DOI - PubMed
    1. Maciel Tabosa M. A.; Vitry P.; Zarmpi P.; Bunge A. L.; Belsey N. A.; Tsikritsis D.; Woodman T. J.; White K. J.; Delgado-Charro M. B.; Guy R. H. Quantification of Chemical Uptake into the Skin by Vibrational Spectroscopies and Stratum Corneum Sampling. Mol. Pharm. 2023, 20, 2527–2535. 10.1021/acs.molpharmaceut.2c01109. - DOI - PMC - PubMed
    1. Caspers P. J.; Bruining H. A.; Puppels G. J.; Lucassen G. W.; Carter E. A. In Vivo Confocal Raman Microspectroscopy of the Skin: Noninvasive Determination of Molecular Concentration Profiles. J. Invest. Dermatol. 2001, 116, 434–442. 10.1046/j.1523-1747.2001.01258.x. - DOI - PubMed

Publication types