. 2024 Sep 27;23(5):651-662.
doi: 10.1093/bfgp/elad045.

STAT3-dependent long non-coding RNA Lncenc1 contributes to mouse ES cells pluripotency via stabilizing Klf4 mRNA

Affiliations

STAT3-dependent long non-coding RNA Lncenc1 contributes to mouse ES cells pluripotency via stabilizing Klf4 mRNA

Emanuele Monteleone et al. Brief Funct Genomics. .

Erratum in

Abstract

Embryonic stem cells (ESCs) preserve the unique ability to differentiate into any somatic cell lineage while maintaining their self-renewal potential, relying on a complex interplay of extracellular signals regulating the expression/activity of pluripotency transcription factors and their targets. Leukemia inhibitory factor (LIF)-activated STAT3 drives ESCs' stemness by a number of mechanisms, including the transcriptional induction of pluripotency factors such as Klf4 and the maintenance of a stem-like epigenetic landscape. However, it is unknown if STAT3 directly controls stem-cell specific non-coding RNAs, crucial to balance pluripotency and differentiation. Applying a bioinformatic pipeline, here we identify Lncenc1 in mouse ESCs as an STAT3-dependent long non-coding RNA that supports pluripotency. Lncenc1 acts in the cytoplasm as a positive feedback regulator of the LIF-STAT3 axis by competing for the binding of microRNA-128 to the 3'UTR of the Klf4 core pluripotency factor mRNA, enhancing its expression. Our results unveil a novel non-coding RNA-based mechanism for LIF-STAT3-mediated pluripotency.

Keywords: Klf4; STAT3; lincRNAs; miR-128; microRNAs; naive pluripotency.


Figures

Figure 1
Figure 1
Identification of putative STAT3-dependent ESC-associated long intergenic non-coding RNAs (lincS). (A) Bioinformatics pipeline for ESC and mouse tissues transcriptome analysis. (B) Heatmap (GeneWise Z-score) representing the expression levels of the 149 lncRNAs identified as most specifically expressed in mESCs, in the indicated tissues or in Bruce ESCs (ENCODE RNA-sequencing data). (C) Heatmap showing the normalized STAT3-binding signal around the TSS (−3 to 3 kb) of genes expressed in mESC. (D) Genomic distribution of STAT3. Top panel: percentage of STAT3 binding at the indicated genomic locations. Bottom panel: STAT3 locations at promoters (~28.6% of all peaks) was further dissected according to the corresponding gene biotype (coding or non-coding). (E) Top panel: density distribution of the distance of STAT3-binding sites to the TSS of associated genes (see materials and methods for the peak–gene association rule). The distance between three STAT3-binding peaks and the TSS of lincS3 lincRNA is indicated by dotted lines intersecting the curve. Bottom panel: overlap between STAT3 peaks and putative regulatory regions of ESC-associated lincRNAs, identifying 11 lincSs.
Figure 2
Figure 2
Lncenc1 is a STAT3-dependent ESC-specific lncRNA. (A, B) Lncenc1 and/or Pou5f1 (Oct4) RNA levels were measured by RT-qPCR in E14 mESCs and (A) the indicated adult mouse tissues, or (B) in derived EBs. Data are represented as the mean ± SD of the values normalized to the 18S rRNA internal control. N = 3. The asterisks indicate statistically significant differences. ***P < 0.0001; *P < 0.01. (C) Integrative Genomics Viewer genome browser picture at the Lncenc1 locus showing the distribution of the H3K4 and H3K36 me3 chromatin marks, RNA-Seq profiles and deCAP-Seq data in E14 ES cells. Below, the RefSeq Lncenc1 isoforms RI–RIII are shown, together with the novel RIV isoform predicted by the deCap experiments. The RT-qPCR primers (arrows) and the probe used in the RNA FISH and Northern blot experiments are also shown. (D) ChIP-qPCR analysis showing STAT3 or PolII-PS5 relative enrichment on the Lincenc1 regulatory region and promoter, respectively, performed in E14 ESCs before or after LIF withdrawal (4 days) and upon 24 hours LIF re-supplementation (5 days). Data are mean ± SD of three independent experiments. ***P < 0.001; **P < 0.01. (E) STAT3-ERT E14 ESCs were deprived of LIF for 6 hours, 2 or 4 days, followed by 24-hour LIF or Tamoxifen re-stimulation prior to protein and RNA extraction. Top panel: Western blot obtained with either total or pYSTAT3 antibodies at the indicated time points. Actin was used as an internal control. The bottom panels show Lincenc1 and Klf4 RNA expression levels measured by RT-qPCR in the same samples, as the mean ± SD of three independent experiments. The asterisks indicate statistically significant difference between LIF-deprived samples, either treated or not treated with TAM at the indicated time points; ***P < 0.001; ns, not significant.
Figure 3
Figure 3
Lncenc1 expression correlates with stemness/naïve ES cells features. (A) Lncenc1 was silenced in E14 cells with two independent shRNAs (sh-Lncenc1-1 and -2) or with a scrambled control (sh-CTRL), followed by morphology analysis in phase contrast images (top left panel) and quantification of colony circularity as a measure of morphology disruption (top right panel). Alkaline phosphatase activity was measured and quantified (bottom panels). Data are mean ± SEM of four independent replicates. The asterisks indicate statistically significant difference between the indicated groups; **P < 0.001; ***P < 0.0001. (B) Relative expression of Lncenc1 RNA in mouse epiblast stem cells (EpiSCs) grown in 2i or reprogrammed toward the naïve state by culturing in 2i + LIF (2iL). *P < 0.01; **P < 0.001; ***P < 0.0001. (C) Heatmap showing hierarchical clustering of differentially expressed genes (FDR < 0.05) in E14 cells following Lincenc1 knockdown by means of ASO, shRNA-1 or -2, or negative controls. (D) The REViGO Scatterplot shows the Enriched GO Clusters representative of genes up- or down-regulated in all three knock-down samples. GO terms along with their P-values are summarized in a two-dimensional space. Correlated GO terms cluster together. Bubble color indicates the P-value, as shown, and size the number of genes falling in that particular GO term. The definition of the selected GO terms indicated is shown in the corresponding tables.
Figure 4
Figure 4
Lncenc1 localization and functional assessment. (A) Lncenc1 RNA was quantified by RT-qPCR on total RNA extracted from the indicated subcellular fractions of E14 cells, and the percentage of RNA localized to the indicated fractions is shown. The prevalently chromatinic Meg3 lincRNA and the cytosolic Actin mRNA (not shown) were also measured as controls. (B) Lncenc1 RNA-FISH and DAPI staining in E14 cells. (C) The differentiation triggered by Lncenc1 silencing in E14 cells was rescued by co-transfecting the pLVX-MRE construct, overexpressing the Lncenc1 MRE region, together with a Lncenc1 shRNA. Top panel: phase contrast imaging of representative colonies. Bottom panel: staining for alkaline phosphatase activity. (D) Quantification of morphology disruption (Colony Circularity) and of alkaline phosphatase staining. Data are shown as mean ± SEM of at least three independent experiments. **P < 0.001, ****P < 0.0001.
Figure 5
Figure 5
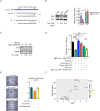
Lncenc1 regulates KLF4 expression by sequestering miR-128. (A) Schematic of Lncenc1 RNA, showing the MRE-enriched region between the arrowheads. Below, representative seed-pairing sites for miR-128 in the Lncenc1 RNA and the Klf4 3’UTR are shown. (B) Klf4 protein and RNA levels were measured in E14 ESCs, silenced or not for Lncenc1 by the indicated treatments. Numbers below the Western blot panel represent the relative Klf4 expression upon normalization to the Vinculin internal control, representative of three independent experiments.Ffold reduction was 50% +/− 5% (ASO) and 50% +/− 4% (shRNA). The histograms represent Lncenc1 and Klf4 RNA levels measured by RT-qPCR in the same samples. Data are mean ± SD of three independent replicates. Values were normalized to the 18S internal control and represented as fold change relative to control cells. The asterisks indicate statistically significant differences (two-tailed paired t-test) between the indicated groups and corresponding control; *P < 0.01; **P < 0.001; ***P < 0.0001. (C) Western blot showing Klf4 protein downregulation upon miR-128 mimic transfection in E14 ESCs. Numbers below the panel represent the relative Klf4 expression upon normalization to the HSP90 internal control. Representative of three independent experiments. (D) Dual luciferase assay in E14 cells transiently co-transfected with the Renilla and the pMIRLuc-Klf4 3′UTR/Mut vectors, together with either control or Lncenc1 shRNA, the miR-128 mimic or Dicer1/control siRNA. Data are mean ± SD of at least three independent experiments. Asterisks indicate statistically significant differences between the indicated groups. ***P < 0.0001; **P < 0.001. (E) E14 cells stably expressing Klf4 and silenced or not for Lncenc1 were stained for Alkaline Phosphatase activity. The quantification shows mean ± SEM of at least three independent experiments. ****P < 0.0001; ns, not significant. (F) Scatter plot showing the in vivo binding enrichment of transcription factors known to be active in mES cells (see Materials and Methods) at promoters of genes downregulated upon Lncenc1 silencing. Each dot represents a TF. The Y-axis shows the log transformed (−log10) significance of enrichment compared to random peaks computed using one-sided Fishers exact test. The X-axis represents the odds of finding a given number of promoters overlapping with a given TF. The size of the dots represents the intersection size. The indicated TFs were considered enriched if falling within the top right area delineated by dotted lines.

References

    1. Evans MJ, Kaufman MH. Establishment in culture of pluripotential cells from mouse embryos. Nature 1981;292:154–6. - PubMed
    1. Takahashi K, Yamanaka S. Induction of pluripotent stem cells from mouse embryonic and adult fibroblast cultures by defined factors. Cell 2006;126:663–76. - PubMed
    1. Bergmann JH, Li J, Eckersley-Maslin MA, et al. Regulation of the ESC transcriptome by nuclear long noncoding RNAs. Genome Res 2015;25:1336–46. - PMC - PubMed
    1. Guttman M, Donaghey J, Carey BW, et al. lincRNAs act in the circuitry controlling pluripotency and differentiation. Nature 2011;477:295–300. - PMC - PubMed
    1. Flynn RA, Chang HY. Long noncoding RNAs in cell-fate programming and reprogramming. Cell Stem Cell 2014;14:752–61. - PMC - PubMed

MeSH terms