. 2024 Jan 2;84(1):101-117.
doi: 10.1158/0008-5472.CAN-23-1992.

XPO1 Enables Adaptive Regulation of mRNA Export Required for Genotoxic Stress Tolerance in Cancer Cells

Affiliations

XPO1 Enables Adaptive Regulation of mRNA Export Required for Genotoxic Stress Tolerance in Cancer Cells

Rossella Marullo et al. Cancer Res. .

Abstract

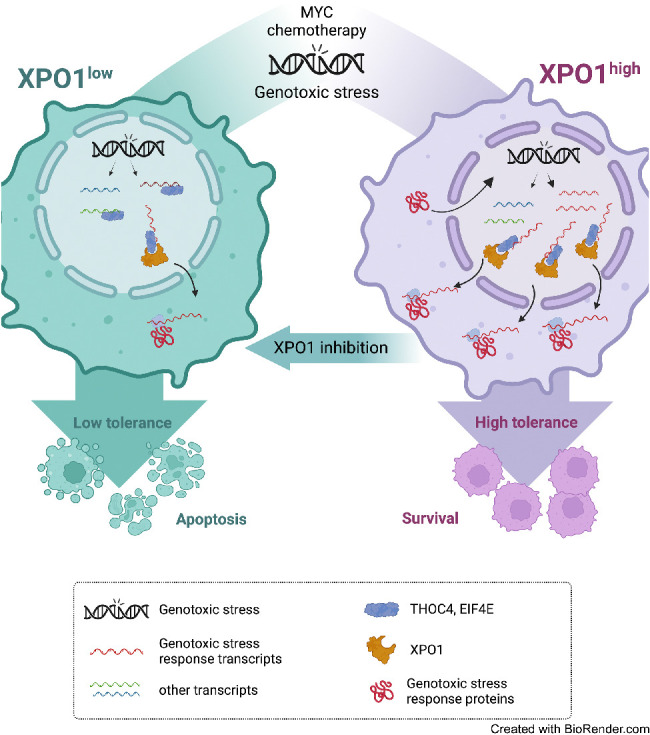
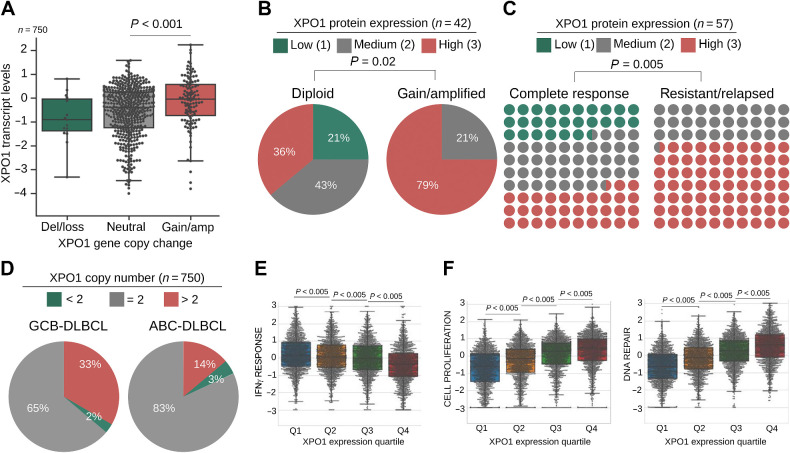
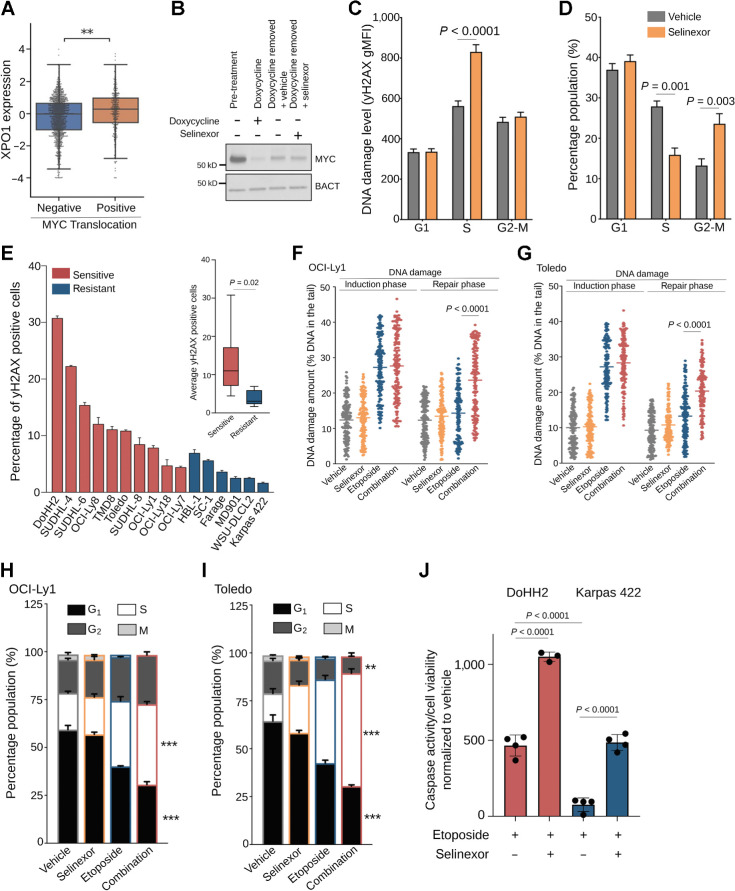
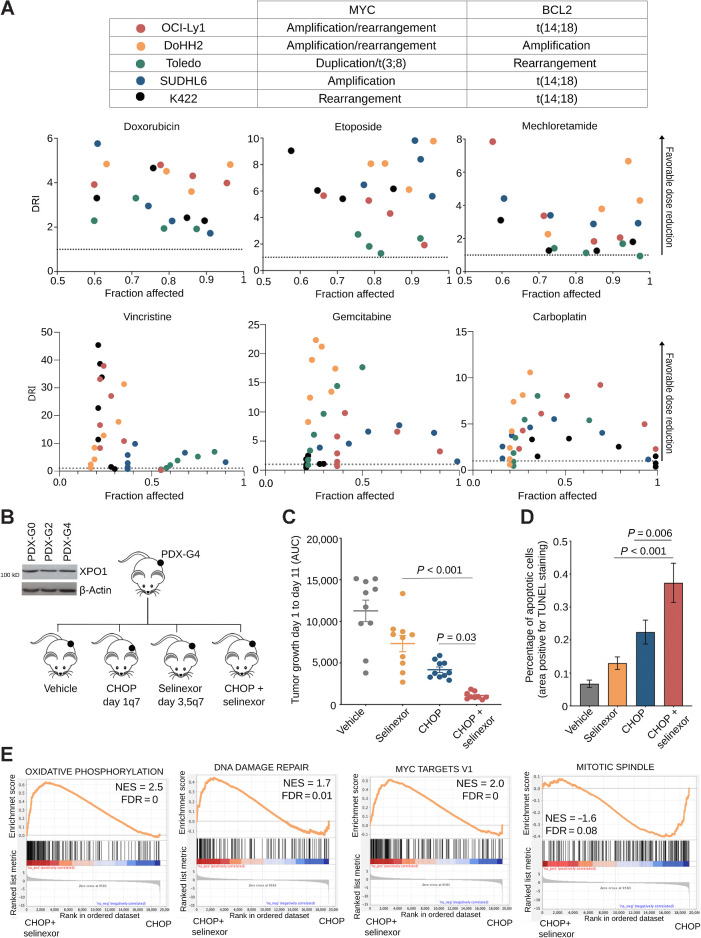
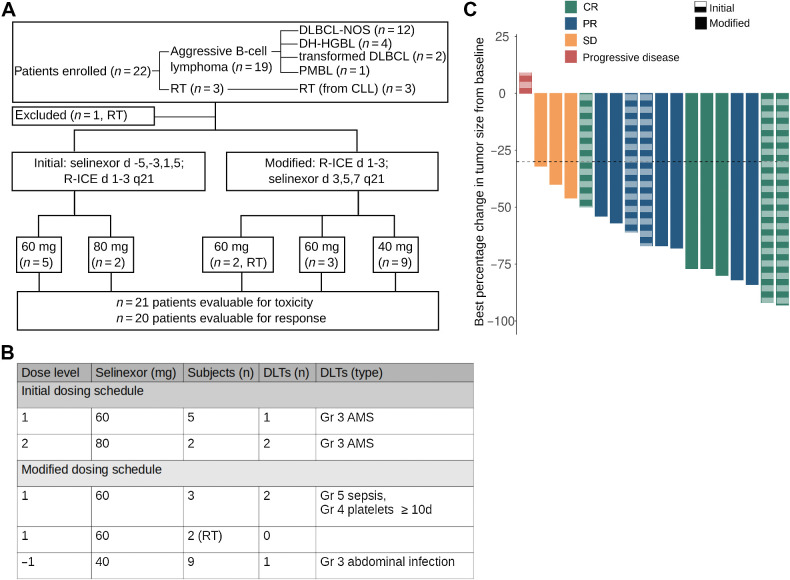
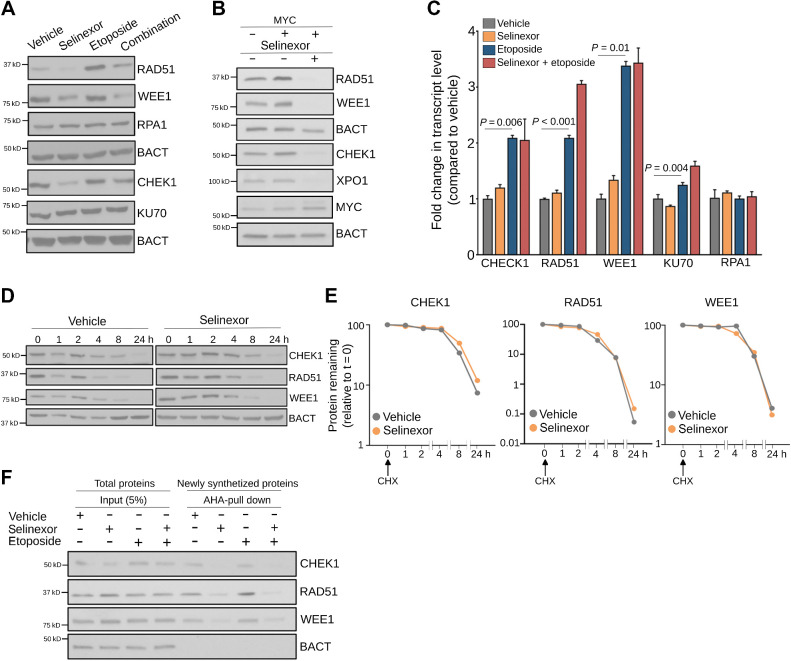
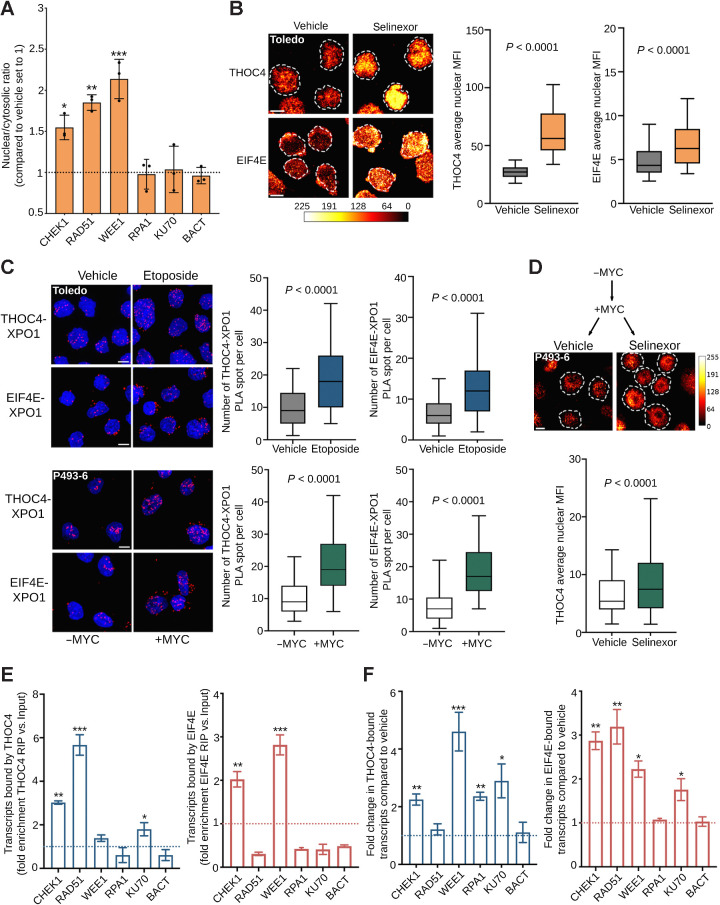
Exportin-1 (XPO1), the main soluble nuclear export receptor in eukaryotic cells, is frequently overexpressed in diffuse large B-cell lymphoma (DLBCL). A selective XPO1 inhibitor, selinexor, received approval as single agent for relapsed or refractory (R/R) DLBCL. Elucidating the mechanisms by which XPO1 overexpression supports cancer cells could facilitate further clinical development of XPO1 inhibitors. We uncovered here that XPO1 overexpression increases tolerance to genotoxic stress, leading to a poor response to chemoimmunotherapy. Upon DNA damage induced by MYC expression or exogenous compounds, XPO1 bound and exported EIF4E and THOC4 carrying DNA damage repair mRNAs, thereby increasing synthesis of DNA damage repair proteins under conditions of increased turnover. Consequently, XPO1 inhibition decreased the capacity of lymphoma cells to repair DNA damage and ultimately resulted in increased cytotoxicity. In a phase I clinical trial conducted in R/R DLBCL, the combination of selinexor with second-line chemoimmunotherapy was tolerated with early indication of efficacy. Overall, this study reveals that XPO1 overexpression plays a critical role in the increased tolerance of cancer cells to DNA damage while providing new insights to optimize the clinical development of XPO1 inhibitors.

Significance: XPO1 regulates the dynamic ribonucleoprotein nuclear export in response to genotoxic stress to support tolerance and can be targeted to enhance the sensitivity of cancer cells to endogenous and exogenous DNA damage. See related commentary by Knittel and Reinhardt, p. 3.


Figures

None
Graphical abstract
Figure 1. XPO1 is overexpressed in resistant and relapsed DLBCL. A, XPO1 copy number (x-axis) and transcript expression (y-axis) in a cohort of 750 treatment-naïve primary DLBCLs. B and C, Frequency of treatment-naïve primary DLBCL cases with low, medium, and high XPO1 protein expression (determined by IHC) in relation to XPO1 copy number (diploid vs. gains, n = 42 pts, WES and WGS; B) and response to R-CHOP (n = 57 pts; C). Statistical analysis was performed by Chi-square test. D, Frequency of XPO1 copy number in 750 treatment-naïve primary DLBCL cases classified as GCB-DLBCL versus ABC-DLBCL by RNA-seq profiling. E and F, IFNγ response (E) and cell proliferation and DNA repair (F) pathway analysis (GSEA) in 4,655 primary DLBCLs stratified by XPO1 increasing gene expression quartiles (Q) by RNA-seq.
Figure 1.
XPO1 is overexpressed in resistant and relapsed DLBCL. A, XPO1 copy number (x-axis) and transcript expression (y-axis) in a cohort of 750 treatment-naïve primary DLBCLs. B and C, Frequency of treatment-naïve primary DLBCL cases with low, medium, and high XPO1 protein expression (determined by IHC) in relation to XPO1 copy number (diploid vs. gains, n = 42 pts, WES and WGS; B) and response to R-CHOP (n = 57 pts; C). Statistical analysis was performed by Chi-square test. D, Frequency of XPO1 copy number in 750 treatment-naïve primary DLBCL cases classified as GCB-DLBCL versus ABC-DLBCL by RNA-seq profiling. E and F, IFNγ response (E) and cell proliferation and DNA repair (F) pathway analysis (GSEA) in 4,655 primary DLBCLs stratified by XPO1 increasing gene expression quartiles (Q) by RNA-seq.
Figure 2. XPO1 promotes DNA damage repair enabling genotoxic stress tolerance. A, XPO1 expression in treatment-naïve primary GCB-DLBCLs harboring or not MYC translocation. B, Immunoblot for MYC expression in P493–6 B cells representing baseline (pretreatment), doxycycline treatment, doxycycline removal (30 min) plus vehicle and doxycycline removal (30 min) plus selinexor conditions. C and D, DNA damage levels (by H2AX staining; C) and cell-cycle distribution (by flow cytometry analysis; D) of P493–6 B cells upon MYC induction (doxycycline removal) and exposure to vehicle or selinexor (1 μmol/L) for 6 hours. E, Baseline DNA damage levels in a panel of 16 DLBCL cell lines assessed by flow cytometry analysis of γH2AX levels. Inset, average level of DNA damage in selinexor sensitive versus resistant DLBCL cell lines. F and G, Comet assay showing the amount of residual DNA damage after 4 hours of exposure (induction phase) and 4 hours withdrawal (repair phase) from 3 μmol/L etoposide (with and without 1 μmol/L selinexor) in OCI-Ly1 (F) and Toledo (G) cells. H and I, Cell-cycle analysis of OCI-Ly1 (H) and Toledo (I) cells exposed to vehicle, selinexor (1 μmol/L), etoposide (3 μmol/L) or their combination for 24 hours. J, Apoptosis analysis by caspase-7/3 activity in DoHH2 (selinexor sensitive) and Karpas422 (selinexor resistant) cell lines upon exposure to vehicle, etoposide, selinexor, and their combination for 72 hours. Data normalized to vehicle-treated and selinexor-treated cells. **, P < 0.005; ***, P < 0.0005.
Figure 2.
XPO1 promotes DNA damage repair enabling genotoxic stress tolerance. A, XPO1 expression in treatment-naïve primary GCB-DLBCLs harboring or not MYC translocation. B, Immunoblot for MYC expression in P493–6 B cells representing baseline (pretreatment), doxycycline treatment, doxycycline removal (30 min) plus vehicle and doxycycline removal (30 min) plus selinexor conditions. C and D, DNA damage levels (by H2AX staining; C) and cell-cycle distribution (by flow cytometry analysis; D) of P493–6 B cells upon MYC induction (doxycycline removal) and exposure to vehicle or selinexor (1 μmol/L) for 6 hours. E, Baseline DNA damage levels in a panel of 16 DLBCL cell lines assessed by flow cytometry analysis of γH2AX levels. Inset, average level of DNA damage in selinexor sensitive versus resistant DLBCL cell lines. F and G, Comet assay showing the amount of residual DNA damage after 4 hours of exposure (induction phase) and 4 hours withdrawal (repair phase) from 3 μmol/L etoposide (with and without 1 μmol/L selinexor) in OCI-Ly1 (F) and Toledo (G) cells. H and I, Cell-cycle analysis of OCI-Ly1 (H) and Toledo (I) cells exposed to vehicle, selinexor (1 μmol/L), etoposide (3 μmol/L) or their combination for 24 hours. J, Apoptosis analysis by caspase-7/3 activity in DoHH2 (selinexor sensitive) and Karpas422 (selinexor resistant) cell lines upon exposure to vehicle, etoposide, selinexor, and their combination for 72 hours. Data normalized to vehicle-treated and selinexor-treated cells. **, P < 0.005; ***, P < 0.0005.
Figure 3. XPO1 inhibition chemosensitizes high-grade B-cell lymphomas. A, Top, table of MYC and BCL2 statuses of the cell lines used in the subsequent experiments. Bottom, DRI of doxorubicin, etoposide, mechlorethamine, vincristine, gemcitabine, or carboplatin in combination with selinexor in a panel of 5 MYC-driven high-grade B-cell lymphoma cell lines including double-hit (i.e., concurrent MYC and BCL2 aberrations). B, Schematic of dosing and scheduling of a R/R DLBCL (carrying copy gains of XPO1, MYC and BCL2) PDTX experiment. XPO1 immunobloting from the primary sample before establishment of the PDTX (PDX-G0), after two passages in mice (PDX-G2) and after four passages in mice (PDX-G4). C, Area under the curve or tumor growth of a R/R DLBCL PDTX treated with vehicle, selinexor, CHOP, or the combination of selinexor + CHOP. D, TUNEL staining quantification of apoptotic index in residual R/R DLBCL PDTX tissue from C. E, Gene set enrichment analysis of genes differentially expressed in R/R DLBCL PDTX treated with CHOP + selinexor versus CHOP alone. NES, normalized enriched score.
Figure 3.
XPO1 inhibition chemosensitizes high-grade B-cell lymphomas. A, Top, table of MYC and BCL2 statuses of the cell lines used in the subsequent experiments. Bottom, DRI of doxorubicin, etoposide, mechlorethamine, vincristine, gemcitabine, or carboplatin in combination with selinexor in a panel of 5 MYC-driven high-grade B-cell lymphoma cell lines including double-hit (i.e., concurrent MYC and BCL2 aberrations). B, Schematic of dosing and scheduling of a R/R DLBCL (carrying copy gains of XPO1, MYC and BCL2) PDTX experiment. XPO1 immunobloting from the primary sample before establishment of the PDTX (PDX-G0), after two passages in mice (PDX-G2) and after four passages in mice (PDX-G4). C, Area under the curve or tumor growth of a R/R DLBCL PDTX treated with vehicle, selinexor, CHOP, or the combination of selinexor + CHOP. D, TUNEL staining quantification of apoptotic index in residual R/R DLBCL PDTX tissue from C. E, Gene set enrichment analysis of genes differentially expressed in R/R DLBCL PDTX treated with CHOP + selinexor versus CHOP alone. NES, normalized enriched score.
Figure 4. Selinexor in combination with R-ICE in patients with aggressive B-cell lymphomas. A, Flowchart of clinical trial design with allocation results and number of DLT events. Twenty-two subjects were enrolled (19 in standard aggressive B-cell lymphoma cohort and three in RT cohort). DLBCL-NOS, DLBCL not otherwise specified; PMBL, primary mediastinal B-cell lymphoma. B, Dosing schedule with patient allocation and DLT for the 19 subjects enrolled in the DLBCL cohort. From the three RT subjects, one subject was taken off the trial prior to receiving selinexor because of neurotoxicity due to ifosfamide and the other two subjects did not experience a DLT. In the initial dosing schedule (n = 3) at 60 mg there were no DLTs. Two DLTs were observed when dose subsequently increased to 80 mg, prompting de-escalation to 60 mg and enrolling three additional subjects at that dose level. One of the second group of three subjects experienced grade 3 AMS. At that point, the protocol was modified so that the selinexor was dosed after completion of ifosfamide. C, Waterfall plot of best relative percent change from baseline in tumor size for 18 patients. Of 20 subjects evaluable for response, one progressed prior to imaging response assessment and one with complete response on PET had no measurable disease, and thus, is not included in the waterfall plot. Solid columns, modified schedule; dashed columns, initial schedule.
Figure 4.
Selinexor in combination with R-ICE in patients with aggressive B-cell lymphomas. A, Flowchart of clinical trial design with allocation results and number of DLT events. Twenty-two subjects were enrolled (19 in standard aggressive B-cell lymphoma cohort and three in RT cohort). DLBCL-NOS, DLBCL not otherwise specified; PMBL, primary mediastinal B-cell lymphoma. B, Dosing schedule with patient allocation and DLT for the 19 subjects enrolled in the DLBCL cohort. From the three RT subjects, one subject was taken off the trial prior to receiving selinexor because of neurotoxicity due to ifosfamide and the other two subjects did not experience a DLT. In the initial dosing schedule (n = 3) at 60 mg there were no DLTs. Two DLTs were observed when dose subsequently increased to 80 mg, prompting de-escalation to 60 mg and enrolling three additional subjects at that dose level. One of the second group of three subjects experienced grade 3 AMS. At that point, the protocol was modified so that the selinexor was dosed after completion of ifosfamide. C, Waterfall plot of best relative percent change from baseline in tumor size for 18 patients. Of 20 subjects evaluable for response, one progressed prior to imaging response assessment and one with complete response on PET had no measurable disease, and thus, is not included in the waterfall plot. Solid columns, modified schedule; dashed columns, initial schedule.
Figure 5. XPO1 sustains the turnover of proteins modulating DNA damage repair. A, Representative immunoblot of indicated DNA damage repair proteins in OCI-Ly1 cells exposed to vehicle, selinexor (1 μmol/L), etoposide (3 μmol/L), or their combination for 24 hours. B, Representative immunoblot of indicated DNA damage repair proteins in P493–6 B-cells after induction of MYC (30 minutes after doxycycline withdrawal) and exposure to vehicle or selinexor (1 μmol/L) for 24 hours. C, Expression levels of transcripts encoding for DNA damage repair protein in OCI-Ly1 cells exposed to vehicle, selinexor (1 μmol/L), etoposide (3 μmol/L), or their combination for 6 hours. D and E, Representative immunoblots (D) of cycloheximide (CHX) chase assay of CHEK1, RAD51, and WEE1 (and actin as control) in OCI-Ly1 cells exposed to vehicle or selinexor (1 μmol/L) for the indicated times. The relative amount of each protein compared with β-actin was quantified by densitometry and plotted with respect to time (E). The protein to β-actin level at baseline was defined as 100%. F, Immunoblots showing CHEK1, RAD51, and WEE1 (and actin as control) protein levels in the newly synthesized fraction (AHA-pulldown) over total protein abundance (input) in OCI-Ly1 cells exposed to vehicle, selinexor (1 μmol/L), etoposide (3 μmol/L), or their combination for 6 hours.
Figure 5.
XPO1 sustains the turnover of proteins modulating DNA damage repair. A, Representative immunoblot of indicated DNA damage repair proteins in OCI-Ly1 cells exposed to vehicle, selinexor (1 μmol/L), etoposide (3 μmol/L), or their combination for 24 hours. B, Representative immunoblot of indicated DNA damage repair proteins in P493–6 B-cells after induction of MYC (30 minutes after doxycycline withdrawal) and exposure to vehicle or selinexor (1 μmol/L) for 24 hours. C, Expression levels of transcripts encoding for DNA damage repair protein in OCI-Ly1 cells exposed to vehicle, selinexor (1 μmol/L), etoposide (3 μmol/L), or their combination for 6 hours. D and E, Representative immunoblots (D) of cycloheximide (CHX) chase assay of CHEK1, RAD51, and WEE1 (and actin as control) in OCI-Ly1 cells exposed to vehicle or selinexor (1 μmol/L) for the indicated times. The relative amount of each protein compared with β-actin was quantified by densitometry and plotted with respect to time (E). The protein to β-actin level at baseline was defined as 100%. F, Immunoblots showing CHEK1, RAD51, and WEE1 (and actin as control) protein levels in the newly synthesized fraction (AHA-pulldown) over total protein abundance (input) in OCI-Ly1 cells exposed to vehicle, selinexor (1 μmol/L), etoposide (3 μmol/L), or their combination for 6 hours.
Figure 6. XPO1 prioritizes the nuclear export of nucleoproteins carrying genotoxic stress transcripts. A, Nuclear/cytoplasmic ratio of selected DNA damage repair transcripts (i.e., CHEK1, RAD51, WEE1, RPA1, and KU70) in Toledo cells exposed to vehicle or selinexor (1 μmol/L) for 6 hours. B, Nuclear levels of THOC4 and EIF4E in Toledo cells exposed to vehicle or selinexor (1 μmol/L) for 6 hours. Left, representative images; right, quantification. The bar represents pixel intensity. C, Proximity ligation assays (PLA) of XPO1-THOC4 and XPO1-EIF4E complexes in Toledo cells exposed to vehicle or etoposide for 6 hours (top) and in P493–6 B-cells with or without MYC expression (bottom). D, Nuclear level of THOC4 in P493–6 B-cells after MYC induction, followed by vehicle or selinexor (1 μmol/L) for 6 hours. The bar represents pixel intensity. E, Ribonucleoprotein immunoprecipitation assays of DNA damage repair transcripts (i.e., CHEK1, RAD51, WEE1, RPA1, and KU70) bound by THOC4 (left) or EIF4E (right) in the nuclear fraction of Toledo cells. Data are presented as fold enrichment over input. F, Change in the amount of DNA damage repair transcripts CHEK1, RAD51, WEE1, RPA1, and KU70 (and actin as control) bound by THOC4 (left) and EIF4E (right) in Toledo lymphoma cells exposed to vehicle or etoposide for 6 hours. Data are presented as fold enrichment over vehicle (normalized by their respective inputs). *, P < 0.05; **, P < 0.01; ***, P < 0.001.
Figure 6.
XPO1 prioritizes the nuclear export of nucleoproteins carrying genotoxic stress transcripts. A, Nuclear/cytoplasmic ratio of selected DNA damage repair transcripts (i.e., CHEK1, RAD51, WEE1, RPA1, and KU70) in Toledo cells exposed to vehicle or selinexor (1 μmol/L) for 6 hours. B, Nuclear levels of THOC4 and EIF4E in Toledo cells exposed to vehicle or selinexor (1 μmol/L) for 6 hours. Left, representative images; right, quantification. The bar represents pixel intensity. C, Proximity ligation assays (PLA) of XPO1-THOC4 and XPO1-EIF4E complexes in Toledo cells exposed to vehicle or etoposide for 6 hours (top) and in P493–6 B-cells with or without MYC expression (bottom). D, Nuclear level of THOC4 in P493–6 B-cells after MYC induction, followed by vehicle or selinexor (1 μmol/L) for 6 hours. The bar represents pixel intensity. E, Ribonucleoprotein immunoprecipitation assays of DNA damage repair transcripts (i.e., CHEK1, RAD51, WEE1, RPA1, and KU70) bound by THOC4 (left) or EIF4E (right) in the nuclear fraction of Toledo cells. Data are presented as fold enrichment over input. F, Change in the amount of DNA damage repair transcripts CHEK1, RAD51, WEE1, RPA1, and KU70 (and actin as control) bound by THOC4 (left) and EIF4E (right) in Toledo lymphoma cells exposed to vehicle or etoposide for 6 hours. Data are presented as fold enrichment over vehicle (normalized by their respective inputs). *, P < 0.05; **, P < 0.01; ***, P < 0.001.

Comment in

References

    1. Cautain B, Hill R, de Pedro N, Link W. Components and regulation of nuclear transport processes. FEBS J 2015;282:445–62. - PMC - PubMed
    1. Wente SR, Rout MP. The nuclear pore complex and nuclear transport. Cold Spring Harb Perspect Biol 2010;2:a000562. - PMC - PubMed
    1. Kosar M, Giannattasio M, Piccini D, Maya-Mendoza A, García-Benítez F, Bartkova J, et al. The human nucleoporin Tpr protects cells from RNA-mediated replication stress. Nat Commun 2021;12:3937. - PMC - PubMed
    1. Zimmerli CE, Allegretti M, Rantos V, Goetz SK, Obarska-Kosinska A, Zagoriy I, et al. Nuclear pores dilate and constrict in cellulo. Science 2021;374:eabd9776. - PubMed
    1. Strambio-De-Castillia C, Niepel M, Rout MP. The nuclear pore complex: bridging nuclear transport and gene regulation. Nat Rev Mol Cell Biol 2010;11:490–501. - PubMed

Publication types

MeSH terms