. 2023 Dec 15;83(24):4142-4160.
doi: 10.1158/0008-5472.CAN-23-0883.

Prostate Cancer Progression Relies on the Mitotic Kinase Citron Kinase

Affiliations

Prostate Cancer Progression Relies on the Mitotic Kinase Citron Kinase

Chitra Rawat et al. Cancer Res. .

Abstract

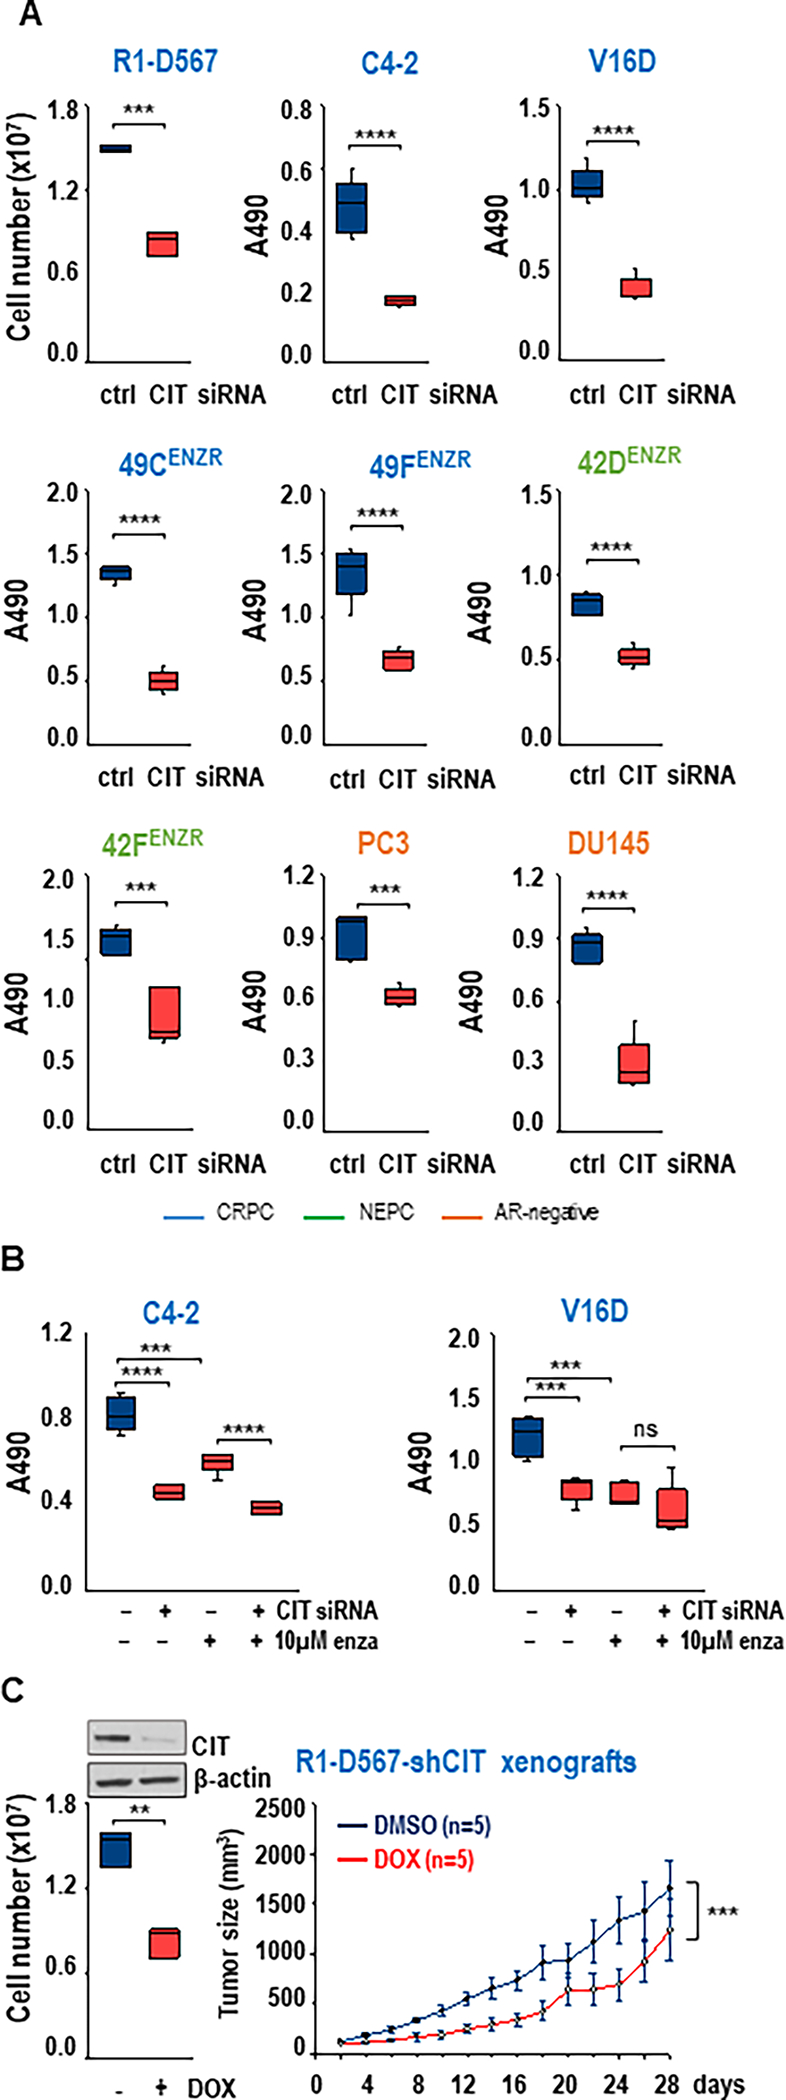
Prostate cancer remains the second leading cause of cancer death in men in Western cultures. A deeper understanding of the mechanisms by which prostate cancer cells divide to support tumor growth could help devise strategies to overcome treatment resistance and improve survival. Here, we identified that the mitotic AGC family protein kinase citron kinase (CIT) is a pivotal regulator of prostate cancer growth that mediates prostate cancer cell interphase progression. Increased CIT expression correlated with prostate cancer growth induction and aggressive prostate cancer progression, and CIT was overexpressed in prostate cancer compared with benign prostate tissue. CIT overexpression was controlled by an E2F2-Skp2-p27 signaling axis and conferred resistance to androgen-targeted treatment strategies. The effects of CIT relied entirely on its kinase activity. Conversely, CIT silencing inhibited the growth of cell lines and xenografts representing different stages of prostate cancer progression and treatment resistance but did not affect benign epithelial prostate cells or nonprostatic normal cells, indicating a potential therapeutic window for CIT inhibition. CIT kinase activity was identified as druggable and was potently inhibited by the multikinase inhibitor OTS-167, which decreased the proliferation of treatment-resistant prostate cancer cells and patient-derived organoids. Isolation of the in vivo CIT substrates identified proteins involved in diverse cellular functions ranging from proliferation to alternative splicing events that are enriched in treatment-resistant prostate cancer. These findings provide insights into the regulation of aggressive prostate cancer cell behavior by CIT and identify CIT as a functionally diverse and druggable driver of prostate cancer progression.

Significance: The poorly characterized protein kinase citron kinase is a therapeutic target in prostate cancer that drives tumor growth by regulating diverse substrates, which control several hallmarks of aggressive prostate cancer progression. See related commentary by Mishra et al., p. 4008.


Conflict of interest statement

Conflict of interest statement: Shaun R. Stauffer, Hannelore V. Heemers, Jonathan D. MacDonald and Salma Ben-Salem are inventors on US patent application 63/170,898 “Citron kinase inhibitors”. The other authors have declared that no conflict of interest exists.

Figures

Figure 1.
Figure 1.. CIT is a key regulator of CaP cell proliferation.
(A) LNCaP cells were treated with increasing doses of R1881 for 48h. CIT and β-actin expression were analyzed by western blotting (top). In parallel, 96h after treatment, Ki67 immunofluorescent staining was done and nuclei counterstained with DAPI. Percentage of Ki67-positive cells was recorded (bottom). (B) VCaP cells were treated with R1881 for 48h and analyzed as under A (top). (C) LNCaP and VCaP cells were treated with indicated doses of dihydrotestosterone (DHT) for 48h and analyzed by western blotting for CIT and β-actin. (D) LNCaP and VCaP cells were treated with increasing doses of FBS for 2 days after overnight serum starvation. Cell lysates were analyzed by western blotting for CIT and β-actin. (E, F) LNCaP cells were transfected with siRNA targeting CIT (CIT) or control siRNA (ctrl). Two days later, cells were treated with 0.1nM R1881 for 96h or vehicle (ethanol) (E) or serum-starved for 24h and treated with increasing doses of FBS for 48h (F). Cell viability was assessed using an MTS assay read at 490 nm in quintuplicate. (G) LNCaP and VCaP cells were transfected with CIT or control (ctrl) siRNA. At 96h after transfection, cell viability was evaluated by MTS assay in quintuplicate (bottom). CIT and β-actin expression were analyzed by western blotting (top). (H) RWPE1, NIH-3T3 and 293T cells were transfected and assayed as under G. (I) Cells were transfected as under G. Cell cycle was evaluated after 72h, 96h, 120h or 144h by propidium iodide cell sorting. Percentage of cells in G0/G1, S, and G2/M phase is shown (in triplicate). Blue, red and black lines compare control vs CIT siRNA-transfected cells in G2/M, S and G0/1 phase, respectively. (J) LNCaP cells were pharmacologically enriched in early G1, late G1, early S, late S and G2/M phase for 24h. Phospho-Rb (S780-RB), Rb, cyclin A, cyclin B1, phospho-histone 3 (S10-H3) and β-actin were analyzed via western blotting. (K) LNCaP cells were transfected with siRNA targeting CIT (CIT) or control (ctrl) siRNA. 72, 96, 120 or 144h after transfection, cells were treated with 2μg/mL aphidicolin (aphid) for 24h. Cell cycle was evaluated as under I. (L) Cells were transfected as under G. At 96h after transfection, multinucleation was analyzed by immunofluorescence staining for the cell membrane marker Na+/K+ ATPase and counterstaining with nuclear marker stain DAPI. Percentage of multinucleated cells is shown. (M) LNCaP cells that express doxycycline-inducible shRNA targeting CIT #2 (Supplementary Figure 2) were treated with 1mg/ml doxycycline (DOX) or vehicle (DMSO) for 96h. Cell viability was evaluated as above (left panel). Cells were grafted subcutaneously in nude mice. Once xenografts reached 100mm3, animals were randomized to doxycycline (DOX, 200μg/ml, n=6, red) or vehicle (DMSO, n=6, blue). Tumor volumes were measured every other day for 28 days. *p<0.05, **p<0.01, ***p<0.001, and ****p<0.0001. Panels A, E, F, G, H, I, J, L, M (left): t-test, Panel M (right): 2-way ANOVA. Data are represented as means ±SEM. ns, non-significant. β-act, β-actin.
Figure 2.
Figure 2.. Clinical and translational relevance of CIT during CaP progression.
(A) Percentage of TMA cores with absent, focal, moderate or marked CIT immunohistochemical staining. (B) Average CIT expression score per tissue core in benign versus CaP tissues. *** p<0.001, t test. Box plots represent mean +/− SEM. (C) Percentage of cores with Gleason score (GS) of 6 (3+3), 7 (3+4 and 4+3), or 8 (4+4) with absent, focal, moderate or marked CIT immunohistochemical staining. (D) GSEA analysis of growth-regulated and basal CIT-dependent gene signatures, comparing CRPC and treatment-naïve CaP (GSE32269). Black bars, no significant enrichment; red bars, significant positive enrichment in CRPC compared to treatment-naïve CaP. Red dashed line: FDR<0.25, considered significant. (E) The PCTA web tool was used to mine PCTA and TCGA gene expression data by CaP subtype information based on GS and metastasis status. The basal CIT-dependent gene signatures were analyzed in the PCTA correlation view analysis function against publically available signatures relevant to mitosis, AR activation, castration resistance and stemness, which are described in the Materials and Methods section. The correlation coefficient and p value derived from each PCTA analysis were recorded and represented graphically using R. * correlation with significance set at p<0.05 in PCTA. Up/down, up- or downregulated upon CIT silencing; B9, benign; all, all tissues.
Figure 3.
Figure 3.. CIT overexpression drives overcomes CaP growth restriction.
(A) Percentage of LNCaP cells in G1, S, or G2/M phase as determined by propidium iodide assays 96h after transient transfection with an expression construct encoding CIT (CIT), kinase-dead CIT (KD) or empty vector (EV). Cells were grown in FBS-supplemented conditions (left) or treated with 0.1nM R1881 or vehicle (ethanol) (right). Black, red and blue lines compare G0/G1, S phase and G2/M phase. (B) LNCaP cells were transfected with increasing amounts of CIT or EV. Four days later, a cell viability assay reading at 490nM (in quintuplicate) was performed. (C) LNCaP cells were transfected with siRNA targeting AR or control siRNA (ctrl). Two days later, cells were transiently transfected with CIT or EV. Two days later, cell proliferation was analyzed via Ki67 staining and percentage of Ki67-positive cells was recorded. (D) LNCaP cells were transiently transfected with CIT or EV. Two days later, cells were treated with 10nM R1881 (+) or vehicle (−) followed by Ki67 staining as above. (E) Parental (left) and isogenic LNCaP cells that stably express doxycycline-inducible CIT (middle) or CIT-KD were treated with 1μg/ml doxycycline (DOX) or vehicle (DMSO) for 96h, followed by an MTS assay read at 490nm (in quintuplicate).The LNCaP subline allowing for inducible CIT expression was grafted in castrated mice, which were randomized to immediate doxycycline treatment (DOX, 20μmg/L in drinking water, n=10) or vehicle (DMSO, n=10). Survival curve detailing animals that died or had to be sacrificed before the study end point (140 days) (right). (F) H&E staining on tissues from CaP-bearing animals from D (right panel), confirming presence of adenocarcinoma (arrows) in dox-treated mice that had to sacrificed at days 86, 108 or died at day 102 (bottom panel). *, area of necrosis. (G) RWPE1 cells were transfected with increasing amounts of CIT or with EV. Four days later, cell proliferation was analyzed via Ki67 staining. *p<0.05,**p<0.01, ***p< 0.001, and ****p<0.0001, t-test. Box plots reflect mean ±SEM.
Figure 4.
Figure 4.. Novel E2F2-Skp2-p27 pathway regulates CIT expression.
(A) Time course with increasing doses of R1881 for 16h and 24h in LNCaP and VCaP cells. CIT and β-actin protein expression was analyzed via western blotting. (B) CIT mRNA levels determined by qRT-PCR after 24h treatment with increasing doses of R1881 in LNCaP (left) and VCaP (right). CIT mRNA levels were normalized to GAPDH expression and are represented as relative expression using the value obtained from one of the biological triplicates from the vehicle-treated condition as 1. Columns, means of values obtained from independent biological triplicates; bars, SEM. (C) Western blot of LNCaP cells treated with 0.1nM R1881 or vehicle for 24h, followed by MG132 or DMSO treatment for 16h. (D) IP using ubiquitin-targeting antibody (ub), followed by western blotting for CIT on LNCaP cells treated with 0.1nM R1881 or ethanol for 24h. IP, immunoprecipitation, IB, immunoblotting. Arrow indicates CIT immunoreactive signal. Insert: Quantification of immunoreactive signals for IP’ed samples. Signals for IP’ed samples were normalized against the value of the matching input sample. (E) Western blot analysis of CIT, E2F1, E2F2, Skp2, p27 and β-actin in LNCaP cells transfected for 96h with siRNA targeting either E2F1, E2F2, E2F3, E2F4, or CIT or with non-specific control (ctrl) siRNA (top left). Quantification of E2F1, E2F2 and CIT immunoreactive signals, normalized against the value of the β-actin signal (right). E2F1, E2F2, E2F3 and E2F4 mRNA levels were determined by qRT-PCR at 96h after transfection with specific siRNAs as under B (bottom left). (F) Protein levels of CIT and β-actin in LNCaP cells transfected as under G with siRNA against either E2F1, E2F2 or control siRNA. Two days later cells were treated with 0.1nM R1881 or vehicle (ethanol). (G) LNCaP cells were transfected with siRNA targeting E2F2 or with non-specific control siRNA. At 48h after transfection, cells were transfected with expression constructs encoding wild-type CIT (CIT) or empty vector (EV). Cell proliferation was evaluated by Ki67 immunostaining. The percentage of Ki67-positive cells was recorded. si, siRNA (H) LNCaP cells were transfected with increasing amounts of an expression construct encoding FLAG-tagged E2F2 or empty vector (EV). Four days later, a cell viability assay reading at 490nM (in quintuplicate) was performed. Left: cells cultured in regular FBS-containing growth medium, right: cells cultured in androgen-deprived medium. **p<0.01, ***p<0.001, ****p<0.001, ns, non-significant, t-test. Box plot reflects mean ±SEM. β-act, β-actin.
Figure 5.
Figure 5.. E2F2 signaling leads to p27-CIT interaction
(A) Western blot analysis of CIT, Skp2, p27, and β-actin levels in LNCaP (top) and VCaP (bottom) cells transfected with control siRNA or siRNA against p27, Skp2 alone or co-transfected with siRNAs targeting p27 and Skp2. Two days later, cells were treated with 0.1nM R1881 or vehicle (ethanol). Note difference in sample loading order between LNCaP and VCaP samples. (B) Co-IP using an antibody targeting p27 and western blotting of CIT in LNCaP (top) and VCaP (bottom) cells treated for 48h with 0.1nM R1881 or vehicle. Blot was reprobed for Skp2 as a positive control for p27 immunoprecipitation.
Figure 6.
Figure 6.. CIT controls growth of CRPC, NEPC and AR-negative CaP.
(A) CRPC cell lines C4–2, R1-D567, V16D, 49CENZR and 49FENZR, NEPC cell lines 42DENZR and 42FENZR, and AR-negative cell lines PC3 and DU145 were transfected with siRNA targeting CIT or non-targeting control siRNA (Ctrl). At 96h after transfection, cell viability was measured via trypan blue staining (R1-D567, biological triplicates) or using an MTS assay in quintuplicate (all other cell lines) read at 490nm. (B) LNCaP cells were transfected using siRNA targeting CIT (+) or non-targeting control siRNA (−). Two days later, cells were treated for 48h with 10μM enzalutamide (enza) (+) or vehicle (DMSO,-). Cell viability was measured using an MTS assay read at 490nm (in quintuplicate). (C) Left: R1-D567 CRPC cells that express doxycycline-inducible shRNA targeting CIT#3 were treated with 1 mg/ml doxycycline (DOX) or vehicle (DMSO). At 96h after transfection, CaP cell viability was evaluated as above (bottom). CIT and β-actin expression were evaluated via western blotting (top). Right: same cell line was used in xenograft experiments. Once xenografts reached 100mm3, animals were randomized and treated with doxycycline (DOX, 200μg/ml in drinking water, n=5 (red) or vehicle (DMSO, n=5, blue). Tumor volumes were measured every other day for 28 days. Data are shown as mean ±SEM. A, B, C (left): **p<0.01, ***p<0.001, ****p<0.0001, t-test. C (right): ***p<0.001, 2-way ANOVA. ns, not significant.
Figure 7.
Figure 7.. CIT is a druggable target for CaP treatment.
(A) LNCaP were transiently transfected with expression constructs encoding wild-type CIT (CIT), citron kinase-dead (CIT-KD), or empty vector (EV) and stimulated with 0.1nM R1881 for 48h. Ki67 immunostaining was performed and percentage of Ki67-positive cells was recorded (bottom). Western blot analysis on parallel samples verified CIT, pMLC2-S19, pMLC2-T18S19, MLC2 and β-actin levels (top) (B) Clinically evaluated kinase inhibitors with CIT EC50<100nM, based on data by Klaeger et al. (43) (left). Validation of CIT inhibition by tofacitinib, Y-39983, dacomitinib, apitolisib, or OTS-167 via in vitro kinase assays (Eurofins) (right). (C) LNCaP, VCaP, C4–2, R1-D567, V16D, 49CENZR, 49FENZR, 42DENZR, 42FENZR, PC3 and DU145 cells were treated with 0, 5, 25 or 100nM OTS-167 or vehicle for 4 days. Cell viability was assessed as detailed in Supplementary Figure 6, which also provides the specific assay data used to generate the heatmap shown here. (D) PDOs derived from the PCSD1 PDX were established. After 2 weeks, PDOs were treated with 50nM OTS-167 or vehicle (DMSO) for 72h. Spheroids and cysts were counted, measured, and values obtained after treatment were normalized using their paired pre-treatment values. (E) LNCaP cells were transfected using siRNA targeting CIT (+) or non-targeting control siRNA (−). Two days later, cells were treated for 48h with 10nM OTS-167 (+) or vehicle (DMSO,-). Cell viability was measured using an MTS assay read at 490nm (in quintuplicate). (F) LNCaP cells were transiently transfected with CIT or EV. The next day, cells were treated with 10nM OTS-167. Four days later, cell viability was measured using an MTS assay read at 490nm (in quintuplicate). Box plots reflect mean ±SEM. *, p<0.05, **, p<0.01, ***p<0.001, ****p<0.0001, t-test.
Figure 8.
Figure 8.. Isolation of in vivo CIT substrates in CaP cells.
(A) MS experiments that were performed to isolate CIT-dependent phosphomarks. IP, immunoprecipitation; MS, mass spectrometry; PLA, biotin-based proximity ligation assay using TurboID gene fusions; biotin; biotinylated proteins that interact with wild-type CIT; p-enriched, phospho-enriched. (B) Western blot analysis for MATR3, THRAP3, and CIT following IP with non-targeting IgG or antibody against CIT in LNCaP cells that were transfected for 96h with control siRNA or siRNAS targeting CIT. (C) Western blot analysis for MATR3, THRAP3, MLC2, histone 3 (HIST3) and CIT following IP with a pSer-specific antibody. Lysates from LNCaP cells that allow for doxycycline-inducible CIT shRNA expression were used at 96h after vehicle (DMSO) or doxycyline treatment (DOX) (left). Lysates from VCaP cells were used at 96h after transfection with control siRNA or CIT targeting siRNA (right). Bottom: Quantification of immunoreactive signals for p-Ser IP’ed samples. Signals for IP’ed samples were normalized against the value of the matching input sample. (D) Western blot analysis for MATR3, THRAP3, MLC2 and CIT following IP with a pSer-specific antibody. Lysates from LNCaP or VCaP cells treated for 96h with DMSO or 10nM OTS-167 (OTS) were used. Right: Quantification of immunoreactive signals for p-Ser IP’ed samples as under C. (E) LNCaP and C4–2 cells were transfected with siRNA targeting CIT, THRAP3 or MATR3, or with non-targeting control siRNA. At 96h after transfection, cell viability was measured using an MTS assay in quintuplicate read at 490nm. Box plots reflect mean ±SEM. **p<0.01, ***p<0.001, t-test. si:siRNA. (F) MSigDB and Spliceosome database analyses of proteins that show CIT-dependent phosphomarks. (G) Overview of alternative splicing patterns. A3, alternative 3’ splice sites; A5, alternative 5’ splice sites; MX, mutually exclusive exons; IR, intron retention; SE, exon skipping (top panel). RNA-Seq data was analyzed for CIT-dependent splicing events using rMATS. Number and type of basal CIT-dependent splicing events (bottom panel) are shown. Red, upregulated; blue, downregulated after CIT silencing. (H) Enrichment of basal CIT-dependent splicing events in splicing patterns in treatment-naïve localized CaP (LOC) versus benign prostate tissue (B9), CRPC versus LOC and NEPC versus CRPC. P values shown in red are <0.05 and considered significant. (I) Novel insights in CIT action in CaP. E2F2-Skp2-p27-dependent mechanism in control of CIT expression in CaP and the critical role for CIT’s kinase action in CaP (left). Cellular signaling and processes in which CIT-dependent phospho-proteins function include previously reported (known) functions such as those in cytokinesis and DNA damage control and novel (unknown) function suggested by the current study such as those in cell cycle progression and alternative splicing (right).

Comment in

References

    1. Siegel RL, Miller KD, Wagle NS, Jemal A. Cancer statistics, 2023. CA Cancer J Clin. 2023;73(1):17–48. - PubMed
    1. Dai C, Dehm SM, Sharifi N. Targeting the Androgen Signaling Axis in Prostate Cancer. J Clin Oncol. 2023:JCO2300433. - PMC - PubMed
    1. Beltran H, Prandi D, Mosquera JM, Benelli M, Puca L, Cyrta J, et al. Divergent clonal evolution of castration-resistant neuroendocrine prostate cancer. Nat Med. 2016;22(3):298–305. - PMC - PubMed
    1. Schaeffer EM, Srinivas S, Adra N, An Y, Barocas D, Bitting R, et al. NCCN Guidelines(R) Insights: Prostate Cancer, Version 1.2023. J Natl Compr Canc Netw. 2022;20(12):1288–98. - PubMed
    1. Ben-Salem S, Venkadakrishnan VB, Heemers HV. Novel insights in cell cycle dysregulation during prostate cancer progression. Endocr Relat Cancer. 2021;28(6):R141–R55. - PMC - PubMed

Publication types