. 2023 Oct 5;30(10):1315-1330.e10.
doi: 10.1016/j.stem.2023.09.001.

Complement factor D targeting protects endotheliopathy in organoid and monkey models of COVID-19

Affiliations

Complement factor D targeting protects endotheliopathy in organoid and monkey models of COVID-19

Eri Kawakami et al. Cell Stem Cell. .

Abstract

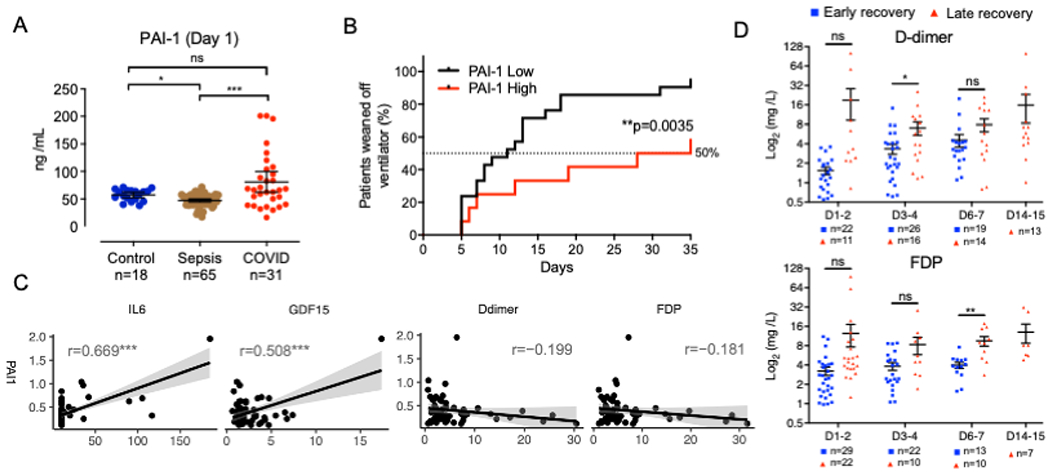
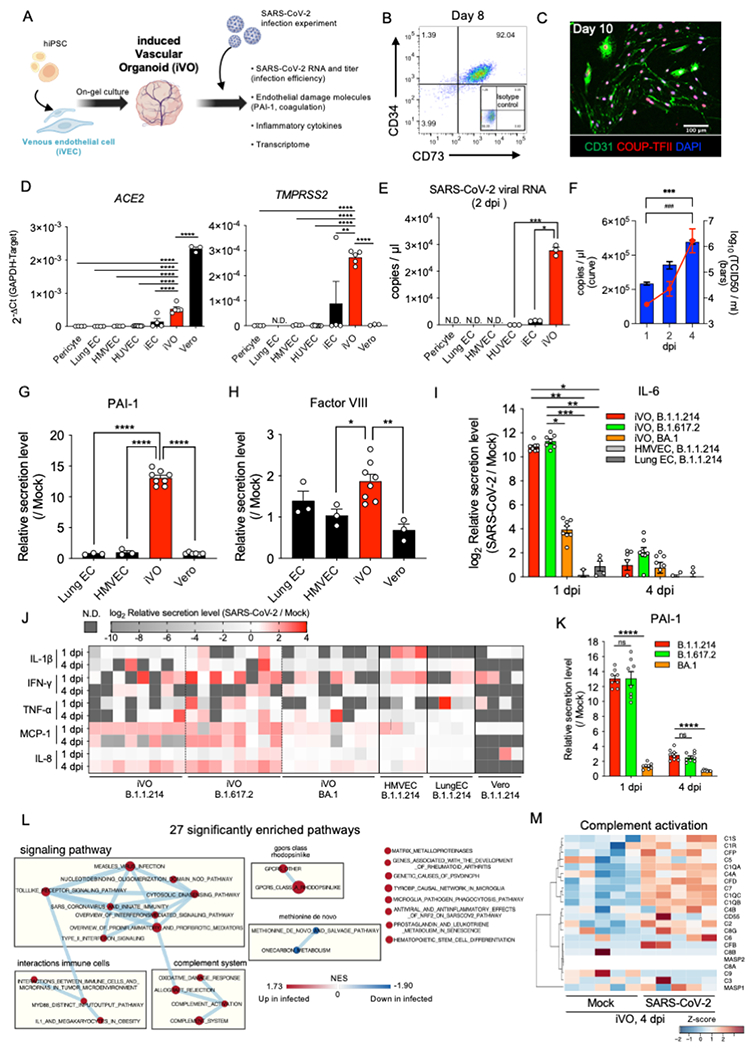
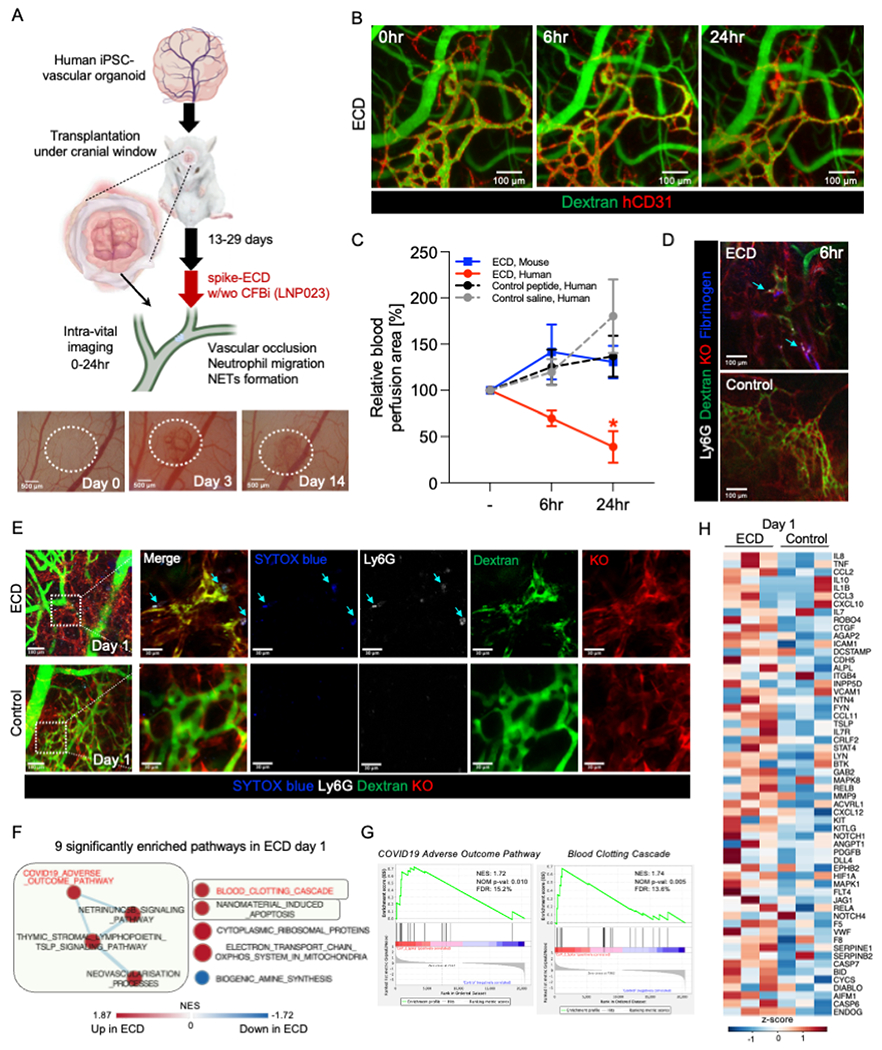
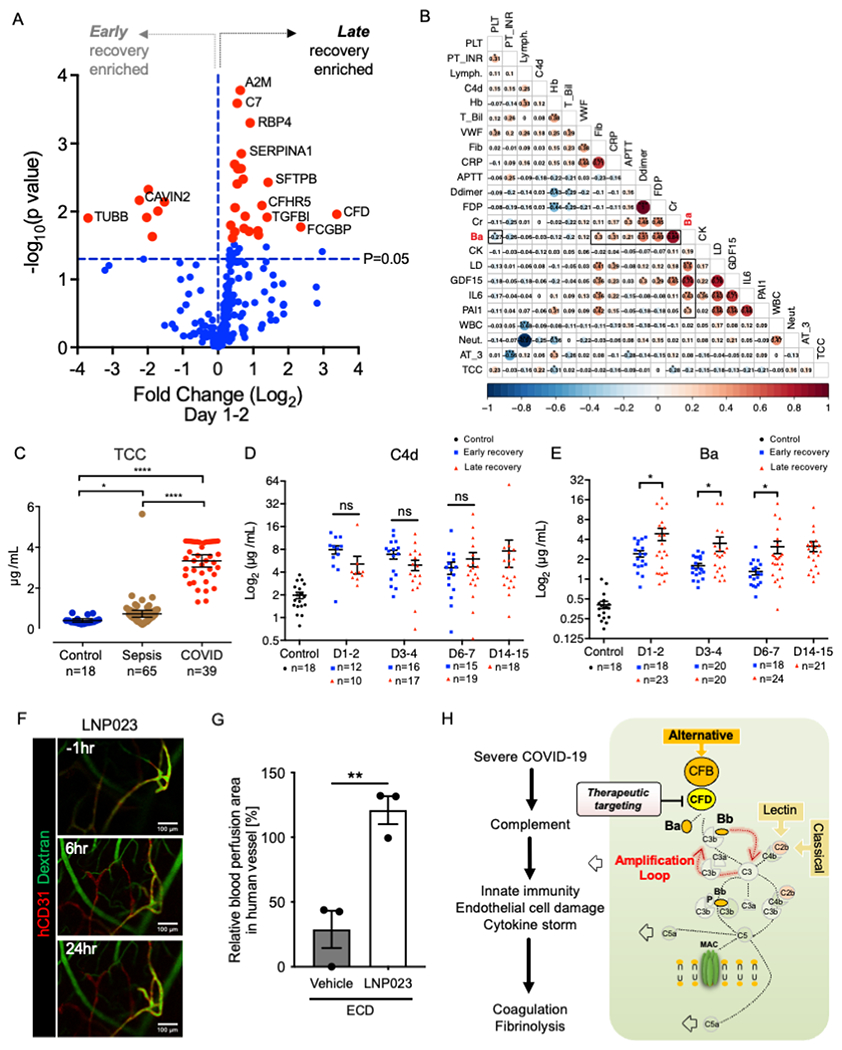
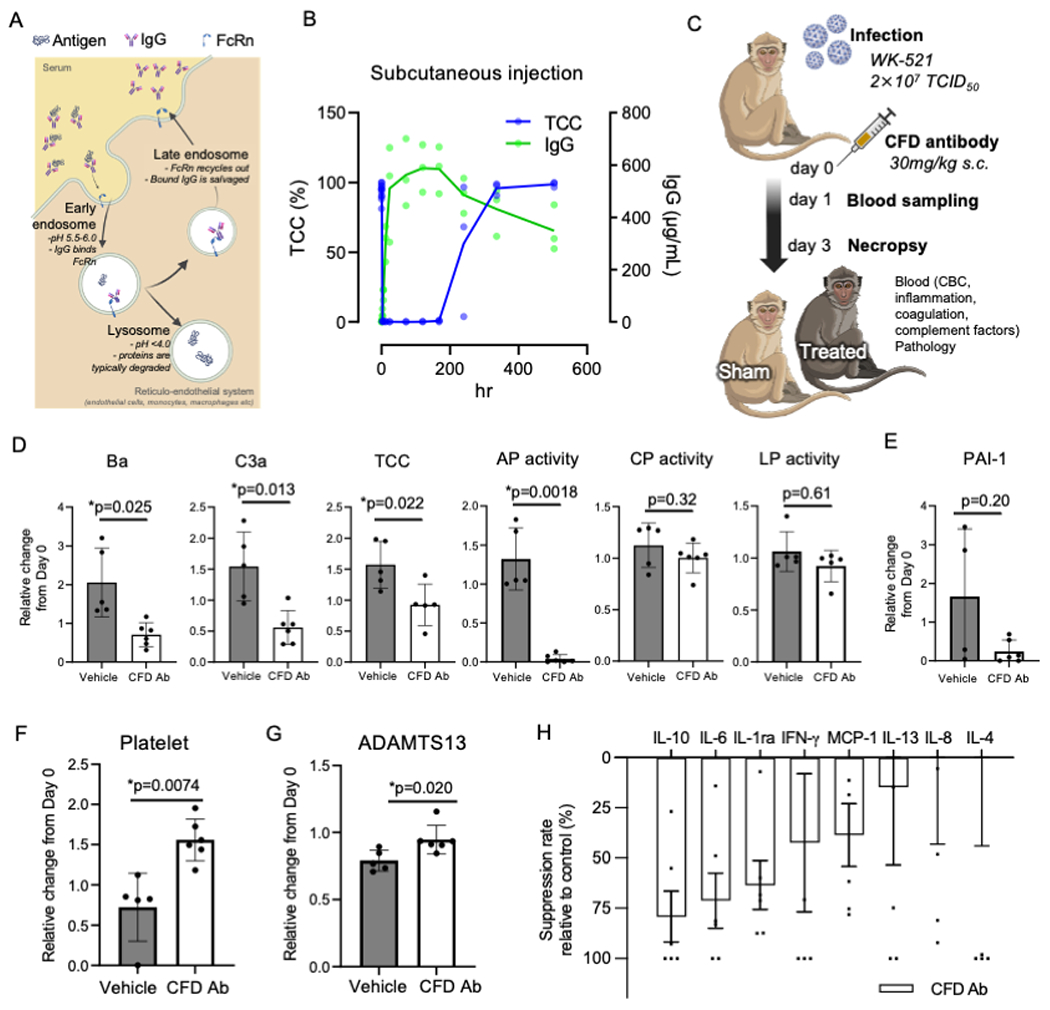
COVID-19 is linked to endotheliopathy and coagulopathy, which can result in multi-organ failure. The mechanisms causing endothelial damage due to severe acute respiratory syndrome coronavirus 2 (SARS-CoV-2) remain elusive. Here, we developed an infection-competent human vascular organoid from pluripotent stem cells for modeling endotheliopathy. Longitudinal serum proteome analysis identified aberrant complement signature in critically ill patients driven by the amplification cycle regulated by complement factor B and D (CFD). This deviant complement pattern initiates endothelial damage, neutrophil activation, and thrombosis specific to organoid-derived human blood vessels, as verified through intravital imaging. We examined a new long-acting, pH-sensitive (acid-switched) antibody targeting CFD. In both human and macaque COVID-19 models, this long-acting anti-CFD monoclonal antibody mitigated abnormal complement activation, protected endothelial cells, and curtailed the innate immune response post-viral exposure. Collectively, our findings suggest that the complement alternative pathway exacerbates endothelial injury and inflammation. This underscores the potential of CFD-targeted therapeutics against severe viral-induced inflammathrombotic outcomes.

Keywords: CFD; SARS-CoV-2; acid-switch half-life extended antibody; complement; cynomolgus macaque; endotheliopathy; iPSC; thrombopathy; vascular organoid.


Conflict of interest statement

Declaration of interests N.S. and T.T. are patent holders associated with the technology described in this project.

Figures

Figure 1.
Figure 1.. Endotheliopathy and inflammathrombosis is a hallmark for severe COVID-19.
(A) Quantification of PAI-1 in healthy control, sepsis patient and COVID-19 patient plasma (mean ± SE; Kruskal-Wallis test with Dunn’s post-hoc test; *p < 0.05; ***p < 0.001; ns: not significant). The number of samples is as indicated. (B) Kaplan-Meier survival curves for time to weaning from ventilator in COVID-19 patients separated into PAI-1 low and high groups (Log-rank test; **p<0.01). (C) Correlation plots of PAI-1 with IL-6, GDF-15, D-dimer and FDP with linear regression. r means Pearson correlation coefficient (***p < 0.001). (D) Time-series comparison of plasma D-dimer and FDP levels between the early recovery (blue dot) and late recovery (red dot) groups. The mean ± SE are shown together in each dot plot with a black line (Welch’s t-test; *p< 0.05; ns: not significant). The number of samples is as indicated.
Figure 2.
Figure 2.. Human vascular organoids are permissive for SARS-CoV-2 infection to induce inflammation.
(A) The schema of SARS-CoV-2 infection and phenotypic analysis for induced vascular organoid (iVO). (B) Scatter dot-plots of the flow cytometry analysis of CD34 and CD73 expression at day 8 in CD34+ purified iVEC cultured with 5 ng/ml VEGF-A at days 6 to 8. (C) Immunofluorescent staining of iVEC for CD31/COUP-TFII/DAPI on day 10 after CD34+ purification. (D) qRT-PCR analysis of ACE2 (left) and TMPRSS2 (right) (n=3-8; mean ± SE; One-Way ANOVA with Tukey’s post-hoc test; **p<0.01; ****p<0.0001). HMVEC, human microvascular endothelial cell; HUVEC, human umbilical vein endothelial cell; iEC, iPSC-derived endothelial cell. (E) qRT-PCR analysis of SARS-CoV-2 viral copy number in cell culture supernatant at 2 dpi (n=3; mean ± SE; One-Way ANOVA with Tukey’s post-hoc test; *p < 0.05; ***p < 0.001). (F) Time-series fold change in SARS-CoV-2 viral RNA copy number (red curve) and titer (blue bars) in cell culture supernatant expression of iVOs (n=4, RNA copy number; n=3, titer; mean ± SE; Two-Way ANOVA; ***p < 0.001, RNA copy number; ###p < 0.001, titer). (G) Quantification of PAI-1 in culture supernatant at 1 dpi. Each value was normalized by the quantitative value in the mock control of the same cell type (n=3-8; mean ± SE; One-Way ANOVA with Dunnet’s post-hoc test compared to iVO; ****p < 0.0001). (H) Quantification of Factor VIII in culture supernatant at 1 dpi. (n=3-8; mean ± SE; One-Way ANOVA with Dunnet’s post-hoc test compared to iVO; *p < 0.05; **p < 0.01). (I) Quantification of IL-6 in culture supernatant of iVO infected with different strains and primary endothelial cells infected with B. 1.1.214 strain at 1 dpi and 4 dpi. Each value was normalized by the quantitative value in the mock control of the same cell type (n=4-8; mean ± SE; One-Way ANOVA Kruskal-Wallis test with Dunn’s post-hoc test; *p < 0.05; **p < 0.01; ***p < 0.001). (J) The heatmap showing inflammatory cytokines and chemokines at 1 dpi and 4 dpi. Each value was log2 transformed fold change of infection / mock. (K) Quantification of PAI-1 in culture supernatant of iVO infected with different strains at 1 dpi and 4 dpi. Each value was normalized by the quantitative value in the mock control of the same cell type (n=8; mean ± SE; One-Way ANOVA with Dunnet’s post-hoc test compared to B. 1.1.214 infected iVO; ****p < 0.0001). (L) Network map of connections among significantly enriched pathways by GSEA of SARS-CoV-2 infected and mock (FDR<20%, p<0.05). Each circle indicates the size of the gene set, and the color scale indicates the normalized enrichment score (NES). (M) The heatmap showing genes in the complement activation pathway. Each value was standardized to z-score.
Figure 3.
Figure 3.. Modeling inflammathrombosis specific to engineered human blood vessels.
(A) Top, schematic representation of our transplantation strategy. Bottom, macroscopic image of transplanted human iPSC-vascular organoid under cranial window. Dotted area indicates the transplanted human iPSC-vascular organoid. (B) Intravital fluorescence microscopy imaging of the organoid-transplanted mice treated with spike-ECD via tail vein. The organoid-derived human vascular and blood flow are visualized using a human-specific anti-CD31 antibody (hCD31) and FITC-dextran, respectively. (C) Quantification of relative blood perfusion area in human and mouse vessels after spike-ECD infusion and in human vessels after control peptide or saline infusion to 0hr (mean ± SD; n = 3; *p < 0.05; ns: not significant; compared to 0hr [-] by ANOVA followed by Dunnett’s test.). (D) Intravital fluorescence microscopy thrombus imaging of transplanted human iPSC-vascular organoid (Kusabira orange (KO)) injected with FITC-dextran, anti-mouse Ly6G antibody (neutrophil), and fluorescence-conjugated fibrinogen 6 hrs after spike-ECD or control peptide infusion. (E) Intravital fluorescence microscopy NETs imaging of transplanted human iPSC-vascular organoid (Kusabira orange (KO)) injected with FITC-dextran, anti-mouse Ly6G antibody (neutrophil), and SYTOX blue (extracellular DNA) 24 hrs after spike-ECD or control peptide infusion. (F) Network map of connections among significantly enriched pathways by GSEA of spike-ECD infusion (FDR<20%, p<0.05). Each circle indicates the size of the gene set, and the color scale indicates the normalized enrichment score (NES). (G) Enrichment plots of selected significantly enriched pathways. (H) The heatmap showing core enrichment genes in pathways highlighted in green in Figure 3F. Each value was standardized to z-score.
Figure 4.
Figure 4.. Complement amplification precedes inflammathrombosis.
(A) Volcano plots showing differentially expressed protein profile between late recovery and early recovery at 1-2 day post ICU admission. Red dots indicate proteins that satisfied FDR cut off (20%). The blue dashed line marks a threshold of p=0.05. (B) Pairwise correlation matrix of complement (Ba, C4d, TCC), PAI-1, cytokines (IL-6, GDF-15) and clinical laboratory parameters in patients with COVID-19. Each value represents a Pearson correlation coefficient (*p < 0.05; **p < 0.01; ***p < 0.001). (C) Quantification of TCC in healthy control, sepsis patient and COVID-19 patient plasmas (mean ± SE; Kruskal-Wallis test with Dunn’s post-hoc test; *p < 0.05; ****p < 0.0001). The number of samples is given under the group name. (D-E) Time-series comparison of plasma C4d and Ba levels between the early recovery (blue dot) and late recovery (red dot) groups. The mean ± SE are shown together in each dot plot with a black line (Welch’s t-test; *p < 0.05, ns: not significant). (F) Intravital imaging of the organoid-transplanted mice treated with complement factor B inhibitor LNP023 and spike-ECD. LNP023 was orally administrated 1 hr before spike-ECD treatment. The organoid-derived human vascular and blood flow are visualized using a hCD31 and FITC-dextran, respectively. (G) Relative quantification of blood perfusion area in human vessels after LNP023 and spike-ECD or sham (ECD+DMSO) treatment to before treatment (mean ± SE; n = 3; Welch’s t-test; **p < 0.01). (H) Aberrant activation of complement amplification loop in endotheliopathy.
Figure 5.
Figure 5.. Factor D monoclonal antibody alleviates inflammation and coagulation responses in SARS-CoV-2 infected non-human primates.
(A) Schematic diagram for ASHE concept for CFD monoclonal antibody. (B) Time-series MAC inhibition activity and CFD Ab concentration in cynomolgus macaques (CMs) serum after subcutaneous injection. (C) Schematic diagram for potency of CFD Ab; CMs were injected vehicle (n = 5) and anti-Factor D (n = 6) treated simultaneously with SARS-CoV-2 infection. (D) Complement factor Ba, complement C3a, TCC, alternative pathway activity, classical pathway activity and lectin pathway activity in serum of experimental CMs (mean ± SD; n=5 or 6 per group; Welch’s t-test; *p< 0.05). (E) The concentration of PAI-1 in plasma (mean ± SD; n=5 or 6 per group). (F) The count of platelet in peripheral blood cells (mean ± SD; n=5 or 6 per group; Welch’s t-test; *p<0.01). (G) The concentration of ADAMTS13 in plasma (mean ± SD; n=5 or 6 per group; Welch’s t-test; *p< 0.05). (H) The level of the inflammatory cytokines and chemokines in day 1 plasma by CFD Ab. Each value was normalized by those of the same individual on day0 and then the percentage of suppression to vehicle was calculated. (mean ± SE; n=6). Statistical evaluation was performed by Student’s t-test (p=0.24, 0.09, 0.23, 0.53, 0.20, 0.75, 0.78, 0.56).

References

    1. Datta PK, Liu F, Fischer T, Rappaport J, and Qin X (2020). SARS-CoV-2 pandemic and research gaps: Understanding SARS-CoV-2 interaction with the ACE2 receptor and implications for therapy. Theranostics 10, 7448–7464. 10.7150/thno.48076. - DOI - PMC - PubMed
    1. Perico L, Benigni A, Casiraghi F, Ng LFP, Renia L, and Remuzzi G (2021). Immunity, endothelial injury and complement-induced coagulopathy in COVID-19. Nat Rev Nephrol 17, 46–64. 10.1038/s41581-020-00357-4. - DOI - PMC - PubMed
    1. Merrill JT, Erkan D, Winakur J, and James JA (2020). Emerging evidence of a COVID-19 thrombotic syndrome has treatment implications. Nat Rev Rheumatol 16, 581–589. 10.1038/s41584-020-0474-5. - DOI - PMC - PubMed
    1. Risitano AM, Mastellos DC, Huber-Lang M, Yancopoulou D, Garlanda C, Ciceri F, and Lambris JD (2020). Complement as a target in COVID-19? Nat Rev Immunol 20, 343–344. 10.1038/s41577-020-0320-7. - DOI - PMC - PubMed
    1. Campbell CM, and Kahwash R (2020). Will Complement Inhibition Be the New Target in Treating COVID-19-Related Systemic Thrombosis? Circulation 141, 1739–1741. 10.1161/CIRCULATIONAHA.120.047419. - DOI - PubMed

Publication types

Substances