. 2023 Oct 5;30(10):1331-1350.e11.
doi: 10.1016/j.stem.2023.08.013.

Human pallial MGE-type GABAergic interneuron cell therapy for chronic focal epilepsy

Affiliations

Human pallial MGE-type GABAergic interneuron cell therapy for chronic focal epilepsy

Marina Bershteyn et al. Cell Stem Cell. .

Abstract

Mesial temporal lobe epilepsy (MTLE) is the most common focal epilepsy. One-third of patients have drug-refractory seizures and are left with suboptimal therapeutic options such as brain tissue-destructive surgery. Here, we report the development and characterization of a cell therapy alternative for drug-resistant MTLE, which is derived from a human embryonic stem cell line and comprises cryopreserved, post-mitotic, medial ganglionic eminence (MGE) pallial-type GABAergic interneurons. Single-dose intrahippocampal delivery of the interneurons in a mouse model of chronic MTLE resulted in consistent mesiotemporal seizure suppression, with most animals becoming seizure-free and surviving longer. The grafted interneurons dispersed locally, functionally integrated, persisted long term, and significantly reduced dentate granule cell dispersion, a pathological hallmark of MTLE. These disease-modifying effects were dose-dependent, with a broad therapeutic range. No adverse effects were observed. These findings support an ongoing phase 1/2 clinical trial (NCT05135091) for drug-resistant MTLE.

Keywords: GABA; MGE; TLE; cell therapy; epilepsy; hESC; interneuron; seizure; transplant.


Conflict of interest statement

Declaration of interests All authors except for L.Z. are employees and/or shareholders of Neurona Therapeutics Inc. C.R.N., J.R., A.K., and A.A.-B. are founders of Neurona. J.R., A.K., and A.A.-B. are members of the scientific advisory board at Neurona.

Figures
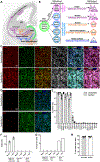
Figure 1.
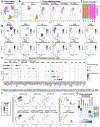
Figure 1.. Post-thaw in vitro characterization of end-of-process cell lots (related to Supp Figs. 1-4)
(A,B) Simplified schematics of neuronal subtypes derived from the MGE progenitor domain (FOXG1+ DLX1/2+ NKX2-1+), including GABAergic pallial interneurons (pINs) that migrate to the cortex and hippocampus (HC), as well as multiple lineages that remain in the subpallium. The latter include striatal GABAergic and cholinergic INs, cholinergic projection neurons (PN) of the basal telencephalon, and GABAergic PNs of the globus pallidus. Listed genes expressed in the immature neurons play critical roles in the specification of the indicated neuronal subtypes. (C,D) Representative ICC images of unsorted and sorted lot 1 after cryopreservation and thaw show expression of MGE pIN markers (LHX6, MAFB, MAF, ERBB4), and cholinergic neurons (ISL1). (E) Protein quantification across independent lots (n=10 to 18). (F,G) Quantification of GABA (F) and Acetylcholine (G) neurotransmitters in the culture supernatant from independent pIN lots (n=8), undifferentiated hESCs (n=1) and spinal motor neurons (n=1). (H) Cell viability post-thaw from independent pIN lots (n=16 unsorted/sorted pairs). In E-H, each dot is an average of technical replicates (2-3) from independently manufactured lots. All data are expressed as a mean ± SEM.
Figure 2.
Figure 2.. Single cell RNA sequencing characterization during the differentiation process and comparison with developing human GE (related to Supp Fig. 5)
Samples that were sequenced included day 0 hESCs (n=1), day 14 MGE progenitors (n=1), and week 6 EOP cells (n=3 paired unsorted/sorted lots). (A,B) UMAP (Uniform Manifold Approximation and Projection) visualization of cell clusters in all the samples combined (A), and in each of the separate samples listed (B). (C) Quantification of sample composition by cluster. (D) Feature plots of gene expression. All cells are displayed in light gray, cells with detectable expression are displayed in purple, with darker shade corresponding to higher expression level. (E) Dot plot for key genes that define different cell categories, including general markers of neurons, GABAergic and GE neurons, MGE, MGE pINs, MGE subpallial neurons, POA, CGE, LGE, neuronal progenitors (including MGE progenitor marker NKX2-1), cell cycle, pluripotent, as well as genes associated with glial cells, glutamatergic neurons (Glu), dopaminergic neurons (DA), serotonergic neurons (5HT) and cholinergic neurons (Ach). (F,G) Comparison of in vitro-derived Day 14 progenitors and EOP INs with human developing GE (GW9-18), using the Shi et al.dataset as a reference. (F) Prediction scores between 0 and 1 are projected onto day 14 and EOP UMAP. (G) Heatmap showing percentage of cells in each in vitro cluster that are assigned to different GE categories based on prediction scores.
Figure 3.
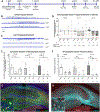
Figure 3.. Electrophysiological characterization of grafted human pINs in the rodent pallium
(A) Cell morphology of GFP-labeled human cells at 2.5 and 5.5 months post transplant (MPT) in the wild-type (WT) mouse cortex. (B) IHC staining with GFP, HNMA and LHX6. (C) Example of a biocytin-filled cell co-stained for GFP and HNA. (D-Q) Whole cell patch-clamp recordings in acute brain slices at 4 and 7.5 MPT (n=5 validated human cells from 1 mouse for each time point). (D, E) Examples of action potentials (AP) recorded from transplanted human pINs at 4.5 and 7.5 MPT. (F-M) Physiological properties, including membrane resistance (F), capacitance (G), resting membrane potential (H), peak intensities for sodium (Na+) and potassium (K+) currents (I), maximum AP firing rate (J), maximum AP amplitude (K), AP width (L) and the threshold to spike (M). (N) Example of an inward current detected at −60mV in the majority of the recorded human cells (n=4 out of 5 cells for both time points), which was blocked by NBQX. (O) Average sEPSC frequency (n=4 each). (P,Q) Individual spike amplitudes (P) and inter-spike intervals (Q) recorded from the human cells at 4 and 7.5 MPT. (R,S) Examples of human pINs firing evoked APs at ~15 MPT in the WT cortex (R, n=10 cells recorded from 2 mice) and in the HC (S, n=5 cells recorded from 1 mouse). (T) IHC staining for ChR2-YFP, HNA and LHX6 in the epileptic HC at ~15 MPT. Regions 1 and 2 are shown at higher magnification with arrows pointing out examples of human cells (HNA+ LHX6+). (U-W) Analysis of sEPSCs detected in the majority of human cells at ~15 MPT in the WT CTX (n = 8 out of 10) and epileptic HC (n = 4 out of 5). (U) average sEPSC frequency, (V) individual sEPSC amplitudes, and (W) inter-event intervals. (X-Z) Blue light stimulation was used to induce inward currents in ChR2-expressing human cells (X), leading to evoked inhibitory postsynaptic currents (eIPSC) that were measured from the host mouse neurons (Y). (Z) Average eIPSC amplitudes recorded from mouse neurons following blue light stimulation in the WT CTX (n = 5 out of 23 recorded cells from 4 mice, ~17 MPT) and in the epileptic HC (n = 2 out of 4 recorded cells from 1 mouse, ~16 MPT). Throughout the figure, scale bars are 100um, except in T (500um); significant differences are indicated by asterisks (*P<0.05; **P<0.01; ****P<0.0001), Mann-Whitney test.
Figure 4.
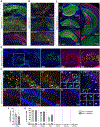
Figure 4.. Seizure suppression after cell transplantation of lots 1U and 1S in the chronic MTLE mouse model (related to Supp Fig. 6)
(A) Experimental timeline. (B-F) EEG was recorded at the indicated time points post-transplant to detect electrographic seizure frequency and duration. Typical electrographic seizure phenotypes in chronically epileptic mice at 1-2, 5 and 7 MPT after vehicle (B) or cell injection (C). (D) Seizure frequency for epileptic animals treated with lots 1-U and 1-S. The mean seizure frequency of the vehicle group is normalized to zero at each respective time point (bar graphs). The individual animals (dots) are plotted as a percent difference from the mean seizure frequency of the respective vehicle control group. A responder-rate threshold was designated for animals exhibiting >75% reduction vs vehicle (depicted as red, dashed line). Mann-Whitney test cell vs. vehicle at respective time point; significant differences are indicated by red asterisks (* P<0.05; ** P<0.01; *** P<0.001). (E,F) Raw data corresponding to D. Cumulative duration of seizures (E) and electrographic seizure frequency (F). In addition, significant changes within a treatment group vs. its own baseline are indicated by hashtags (Kruskal Wallis test followed by Dunn’s; #P<0.05; ## P<0.01; ###P<0.001). (G, H) Human cells (HNA+) migrated and dispersed throughout the HC. Expression of IN subtype marker SST (G) and neuronal marker MAP2 (H) is shown at 8.5 MPT.
Figure 5.
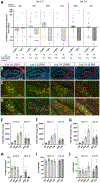
Figure 5.. Histological characterization of lots 1-U and 1-S in the epileptic mouse HC (related to Supp Fig. 6)
(A,B) Expression of immature neuronal marker doublecortin (DCX) (A) and MGE IN marker SST (B) in human cells (HNA+) at 1, 4 and 8.5 MPT. (C) Human-specific axonal marker hTAU showing transplanted cell processes throughout the epileptic HC (a-d), counter-stained with NEUN. (D) Grafted human cells were analyzed by FISH using probes against a housekeeping gene for human-specific glyceraldehyde-3-phosphate dehydrogenase (hGADPH) and the GABAergic marker glutamate decarboxylase 1 (GAD1). Representative image shows cell distribution in the rostral HC with a higher magnification example of the hilus (1). (E) Representative IHC images showing co-labeling of human cells (HNA+, red) with on-target MGE IN markers in green: LHX6, SST, NPY, PV as well as perineuronal nets marker WFA (white). Arrowheads point to specific examples of human cells expressing the markers of interest. Off-target populations, including markers for non-MGE lineage INs (CR), oligodendrocytes (OLIG2), human astrocytes (hGFAP), and proliferating cells (KI67) are shown. (F,G) Quantification of human cell persistence (F) and percent of human cells expressing GAD1 mRNA, and LHX6, SST, KI67, OLIG2 and GFAP proteins (G).
Figure 6.
Figure 6.. Dose-response seizure suppressing activity of human pINs in the MTLE model
(A) Four doses of unsorted lot 2-U (25K, 50K, 200K or 1.5M cells/HC) and two of the higher doses of sorted lot 2-S were evaluated. Vehicle group mean seizure frequency is normalized to zero. Bar graphs represent median and dots correspond to individual animals. Significant differences between cell vs. vehicle groups at each time point are indicated by asterisk (*P<0.05), Mann-Whitney test (200K and 1.5M dose groups vs. respective vehicle groups). Kruskal Wallis test between 25K and 50K vs. corresponding vehicle group was not significant at any of the time points. A responder-rate threshold was designated for animals exhibiting >75% reduction vs vehicle (depicted as red, dashed line). (B-D) Histology panel shows human cell persistence (HNA+), distribution and fate in the epileptic HC for the four doses at 8.5 MPT. (C,D) Higher magnification images of the corresponding dentate gyrus showing expression of MGE markers LHX6 (C) and SST (D). (E-J) Quantification of human cell persistence and fate of lots 2-U and 2-S. Total persisting human cell number marked by HNA (E), HNA/LHX6 (F) and HNA/SST (G) at 8.5 MPT. (H) Relative human cell persistence as a percentage of HNA cells over the initial dose. (I, J) Quantification of LHX6 (I) and SST (J) out of the total persisting human cells (HNA+).
Figure 7.
Figure 7.. Epileptic HC pathology, behavioral outcome, and animal survival after human pIN transplantation
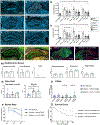
(A-H) Granule cell dispersion analysis at 8.5 MPT in age-matched mice: DAPI labeling shows representative granule cell (GC) layer in naive mouse (A), epileptic vehicle-treated mouse (B) and epileptic cell-treated mice transplanted with 25K, 50K, 200K and 1.5M human cells/HC of lot 2-U (C-F). (G,H) Average GC layer width (G) was measured at three places, as illustrated with white lines in B, and GC layer area (H) was measured as illustrated with a white boundary in B. All data are mean ± SEM. Three vehicle groups were used to match the delivery volumes of the respective cell doses, labeled as Vehicle-Low, Vehicle-Mid and Vehicle-High. The Kruskal Wallis statistic, followed by Dunn’s test, was significant between cell and vehicle groups at all doses for both unsorted and sorted lots (P<0.05). (I,J) Apoptotic cell labeling with cleaved CASP3 in vehicle (I) or cell-treated (J) mice. (K, L) IHC staining for endogenous CALB-expressing neurons in the GC layer of vehicle (K) or cell-treated (L) mice. (M-O) Data are shown for the highest tested dose of 1.5 M cells/HC of lot 2-U (green). All data are expressed as median with interquartile range. (M) Modified Irwin screen (sedation). (N) Open Field test (general anxiety, spatial locomotion and travel velocity). (O) Y maze test (spatial memory). (P) Barnes maze (learning and memory) using naive mice (blue, n=13), epileptic vehicle-injected mice (black, n=11) and epileptic cell-transplanted mice with 200K cell dose (green, n=13). Mann Whitney test for differences between cell and vehicle groups; significant differences are indicated by asterisk (P<0.05). (Q) Survival curves for epileptic animals treated with either vehicle (black), or transplanted with unsorted (200K, Lots 1-U/2-U, light gray, n=47) or sorted (200K, Lots 1-S/2-S dark gray, n=52). Significantly increased survival at 200 days post-transplant was observed with both unsorted and sorted cell lots compared to vehicle treatment (Chi-square test , P<0.05).

References

    1. Fisher RS, van Emde Boas W, Blume W, Elger C, Genton P, Lee P, and Engel J Jr. (2005). Epileptic seizures and epilepsy: definitions proposed by the International League Against Epilepsy (ILAE) and the International Bureau for Epilepsy (IBE). Epilepsia 46, 470–472. - PubMed
    1. Walia KS, Khan EA, Ko DH, Raza SS, and Khan YN (2004). Side effects of antiepileptics--a review. Pain Pract 4, 194–203. 10.1111/j.1533-2500.2004.04304.x. - DOI - PubMed
    1. Cramer JA, Mintzer S, Wheless J, and Mattson RH (2010). Adverse effects of antiepileptic drugs: a brief overview of important issues. Expert Rev. Neurother 10, 885–891. 10.1586/ern.10.71. - DOI - PubMed
    1. Leppik IE (1992). Intractable epilepsy in adults. Epilepsy Res. Suppl 5, 7–11. - PubMed
    1. Schmidt D, and Löscher W (2005). Drug resistance in epilepsy: putative neurobiologic and clinical mechanisms. Epilepsia 46, 858–877. - PubMed

Publication types

Associated data