. 2023 Oct 5;110(10):1750-1768.
doi: 10.1016/j.ajhg.2023.09.004.

Heterozygous deletion of the autism-associated gene CHD8 impairs synaptic function through widespread changes in gene expression and chromatin compaction

Affiliations

Heterozygous deletion of the autism-associated gene CHD8 impairs synaptic function through widespread changes in gene expression and chromatin compaction

Xi Shi et al. Am J Hum Genet. .

Abstract

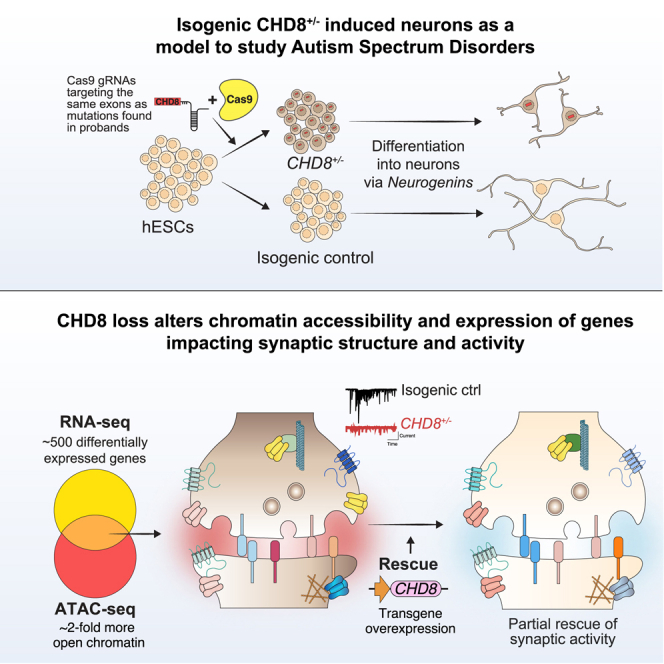
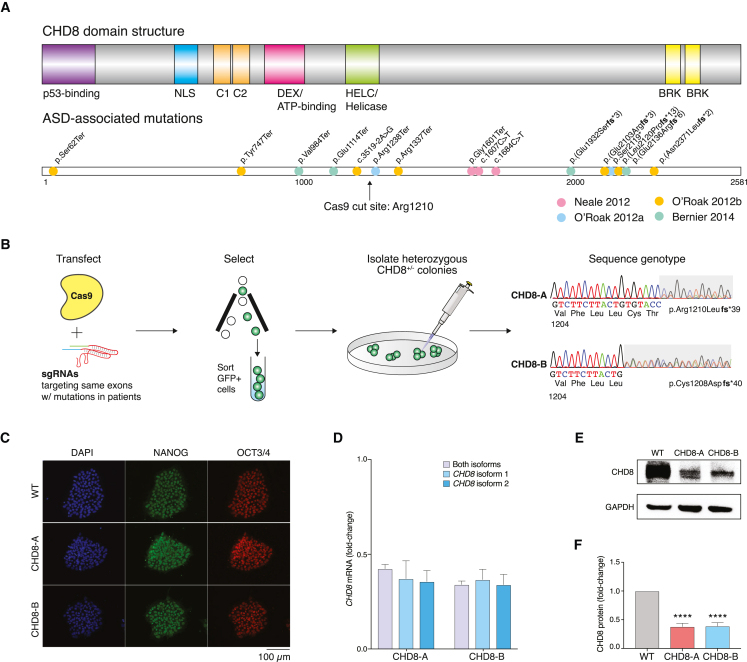
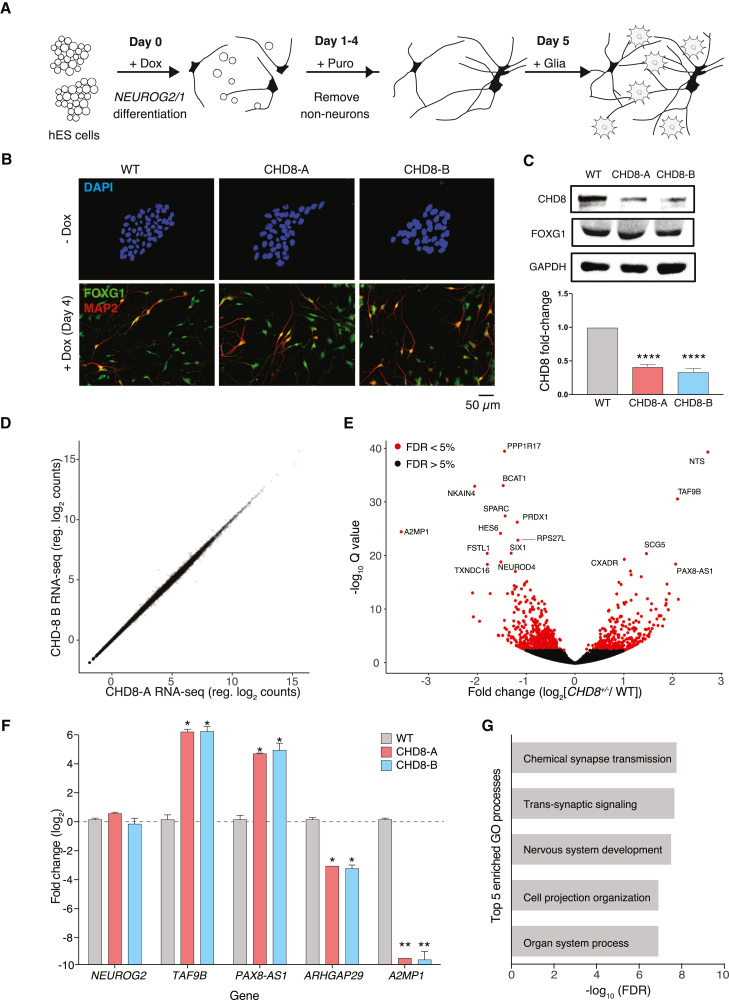
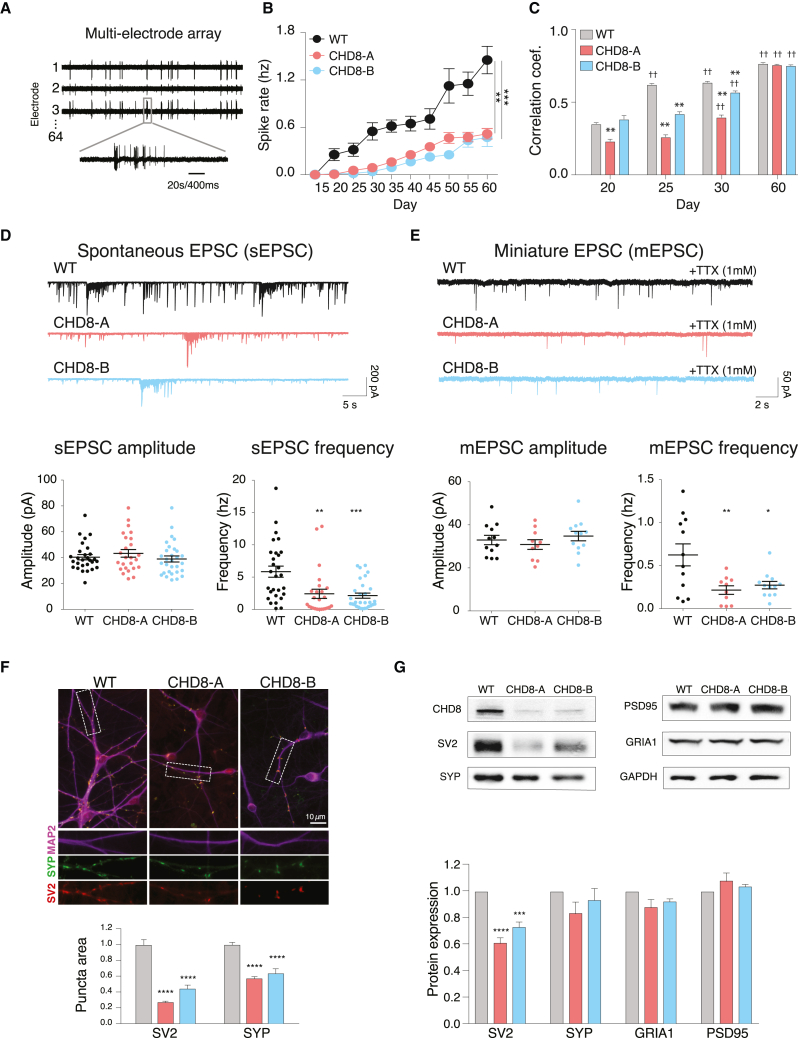
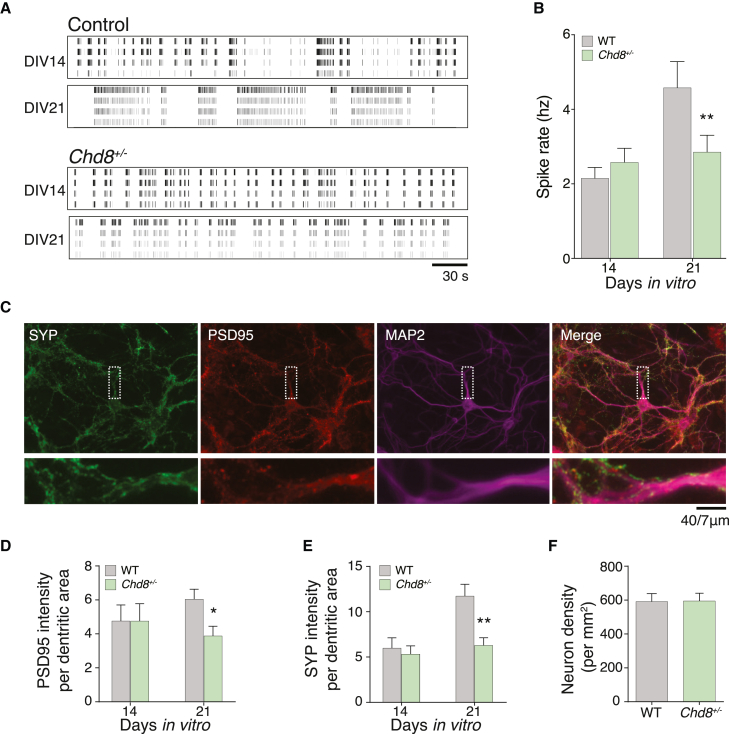
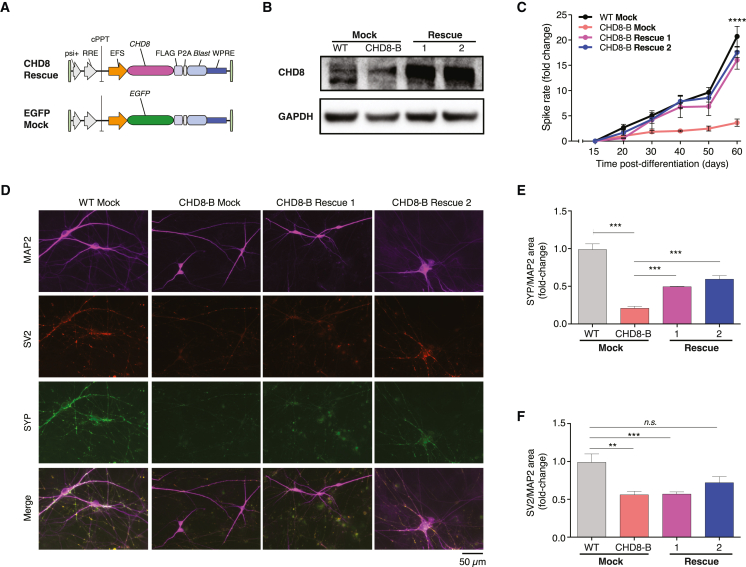
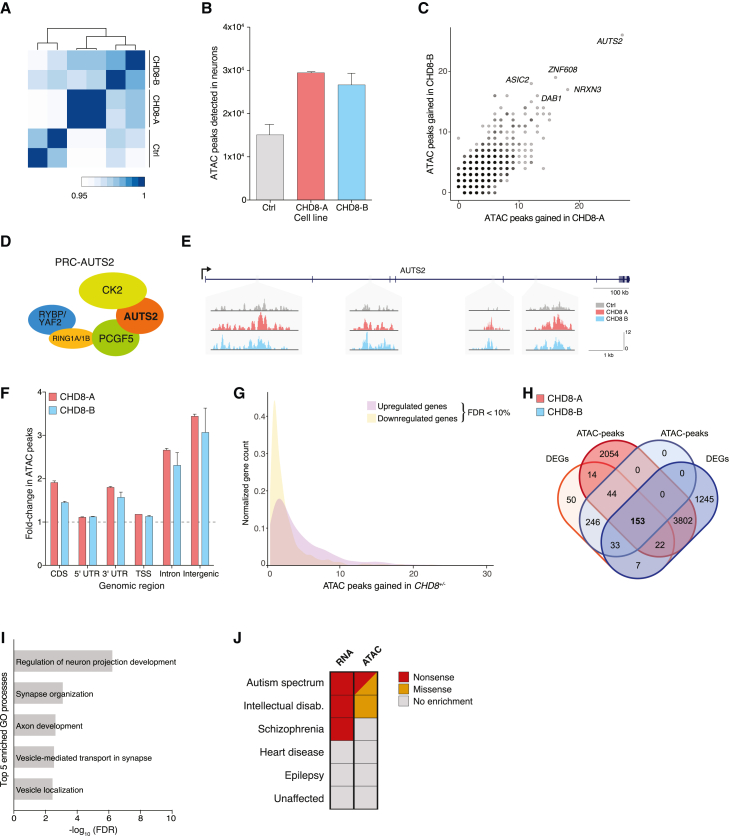
Whole-exome sequencing of autism spectrum disorder (ASD) probands and unaffected family members has identified many genes harboring de novo variants suspected to play a causal role in the disorder. Of these, chromodomain helicase DNA-binding protein 8 (CHD8) is the most recurrently mutated. Despite the prevalence of CHD8 mutations, we have little insight into how CHD8 loss affects genome organization or the functional consequences of these molecular alterations in neurons. Here, we engineered two isogenic human embryonic stem cell lines with CHD8 loss-of-function mutations and characterized differences in differentiated human cortical neurons. We identified hundreds of genes with altered expression, including many involved in neural development and excitatory synaptic transmission. Field recordings and single-cell electrophysiology revealed a 3-fold decrease in firing rates and synaptic activity in CHD8+/- neurons, as well as a similar firing-rate deficit in primary cortical neurons from Chd8+/- mice. These alterations in neuron and synapse function can be reversed by CHD8 overexpression. Moreover, CHD8+/- neurons displayed a large increase in open chromatin across the genome, where the greatest change in compaction was near autism susceptibility candidate 2 (AUTS2), which encodes a transcriptional regulator implicated in ASD. Genes with changes in chromatin accessibility and expression in CHD8+/- neurons have significant overlap with genes mutated in probands for ASD, intellectual disability, and schizophrenia but not with genes mutated in healthy controls or other disease cohorts. Overall, this study characterizes key molecular alterations in genome structure and expression in CHD8+/- neurons and links these changes to impaired neuronal and synaptic function.

Keywords: ASD; CHD8; CRISPR; autism; chromatin; chromodomain; helicase; isogenic; neurodevelopment; synaptic transmission.


Conflict of interest statement

Declaration of interests F.Z. is a scientific advisor to and cofounder of Editas Medicine, Beam Therapeutics, Pairwise Plants, Arbor Biotechnologies, Proof Diagnostics, and Aera Therapeutics. F.Z. is a scientific advisor to Octant. N.E.S. is a scientific advisor to Qiagen and is a scientific advisor to and cofounder of OverT Bio.

Figures

None
Graphical abstract
Figure 1
Figure 1
Generation of two isogenic CHD8+/− hESCs via CRISPR editing (A) ASD-associated mutations have been identified throughout the CHD8 coding sequence. (B) Fluorescence-assisted cell-sorting strategy for isolating clonal isogenic hESCs with distinct heterozygous loss-of-function CHD8 mutations, termed CHD8-A and CHD8-B (resulting in premature stop codons at amino acid positions 1248 and 1247, respectively). These mutations are in CHD8 positions similar to the stop-gain mutations found in (A). (C) CHD8+/− and an isogenic control hESCs retain pluripotency markers NANOG and OCT4 after genome engineering. (D) qPCR in hESCs for CHD8+/− and isogenic control lines using primers that detect the indicated isoform or all isoforms of CHD8. (E and F) CHD8 detection via western blot in CHD8+/− and isogenic control hESCs (E) and quantification (F). All experiments were performed with three biological replicates. Statistical analyses were done with one-way ANOVA tests: ∗∗∗∗p < 10−4. Error bars indicate SEM.
Figure 2
Figure 2
Differentiation of isogenic CHD8+/− neurons and RNA-seq of neurons at post-differentiation day 9 (A) Cortical neuron differentiation via overexpression of NEUROG2 and NEUROG1. (B) ICC of FOXG1 and MAP2 after 4 days of differentiation. (C) Western blot of CHD8 and FOXG1 and quantification of CHD8 after 4 days of differentiation. (D) Quantification of gene expression in CHD8-A and CHD8-B isogenic cell lines after 9 days of differentiation. (E) Volcano plot of differential gene expression between CHD8+/− neurons and isogenic control neurons. (F) qPCR of several differentially expressed genes between CHD8+/− and isogenic control neurons (and also NEUROG2). (G) Top five enriched GO processes in CHD8+/− neurons according to differential gene expression after 9 days of differentiation. All experiments were performed with three biological replicates. Statistical analyses were done with one-way ANOVA tests: p < 0.05, ∗∗p < 0.01, ∗∗∗∗p < 10−4. Error bars indicates SEM.
Figure 3
Figure 3
Characterization of electrophysiological and synaptic changes in human isogenic CHD8+/− neurons (A) Example of field potential recording using MEAs. (B) Average spike rate of human cortical neurons recorded every 5 days from post-differentiation day 15 to day 60. (C) Average correlation coefficient between all pairs of electrodes. Significant differences at a single time point. †Significant differences for a single cell line between neighboring time points. (D) Voltage-clamp recordings of sEPSCs and quantification of sEPSC amplitude and frequency. (E) Voltage-clamp recordings of mEPSCs using TTX and quantification of mEPSC amplitude and frequency. (F) ICC for MAP2, SYP, and SV2 and quantification of the fold change over the isogenic control cell line in SYP and SV2 puncta area per unit dendrite (MAP2) area. (G) Protein expression via western blot for both presynaptic proteins SYP and SV2 and postsynaptic proteins PSD95 and GRIA1 (GluR1) (top) and quantification relative to GAPDH (bottom) after 32 days of differentiation. All experiments were performed with three biological replicates. Statistical analyses were done with one-way ANOVA tests: ∗∗p < 0.01, ∗∗∗p < 10−3, ∗∗∗∗p < 10−4. Error bars indicate SEM.
Figure 4
Figure 4
Multielectrode array recordings and synaptic puncta in cortical neurons from Chd8 heterozygous mice (A) Spike raster plot from mouse cortical neurons at DIV 14 and 21. (B) Spike rate for cortical neurons recorded at DIV 14 and 21. (C) ICC for MAP2, SYP, and PSD95 at DIV 21. (D) Integrated PSD95 intensity per unit dendrite (MAP2) area. (E) Integrated SYP intensity per unit dendrite (MAP2) area. (F) Neuron density per unit area (mm2) by NeuN identification of neuronal nuclei. All experiments were performed with three biological replicates. Statistical analyses were done with unpaired t tests: p < 0.05, ∗∗p < 0.01. Error bars indicate SEM.
Figure 5
Figure 5
Lentiviral rescue of CHD8 in human isogenic cells (A) Lentiviral constructs for rescue experiments delivering CHD8 or EGFP coupled to a blasticidin selection gene. The transgenes are ubiquitously expressed by the EFS promoter. (B) Transduction of CHD8-B cells with the CHD8 rescue lentivirus restores WT CHD8 levels. (C) Spike rates from multielectrode array recording of CHD8-B cells with CHD8 rescue lentivirus in comparison with those of WT or CHD8-B cells with mock transduction (mean ± SD). (D) ICC for MAP2, SYP, and SV2 at day 53 in WT cells with mock transduction, CHD8-B cells with mock transduction, and CHD8-B cells with CHD8 rescue lentivirus. (E and F) Integrated SYP (E) and SV2 (F) intensity per unit dendrite (MAP2) area normalized to WT cells with mock transduction (mean + SD). All experiments were performed with three biological replicates. Statistical analyses were done with one-way ANOVA tests: ∗∗p < 0.01, ∗∗∗p < 10−3, ∗∗∗∗p < 10−4. Error bars indicate SEM unless otherwise stated.
Figure 6
Figure 6
Chromatin accessibility of isogenic CHD8+/− neurons and comparison with genetic data from whole-exome sequencing of probands (A) Clustering of aligned reads from ATAC-seq using 100-kb genomic windows. The analysis was done with two biological replicates per sample. (B) MACS2-detected ATAC-seq peaks in human neurons at post-differentiation day 9 in CHD8+/− and isogenic controls. (C) Mapping of novel peaks in CHD8+/− neurons to nearest gene for CHD8-A and CHD8-B lines. (D) Schematic of PRC-AUTS2 complex. (E) Examples of regions within AUTS2 with additional open-chromatin peaks. (F) Fold change in ATAC-seq peaks across different types of genomic regions in CHD8+/− and isogenic control neurons. (G) Changes in gene expression (upregulation or downregulation) for genes with gains in ATAC-seq peaks in CHD8+/− neurons. (H) Venn diagram showcasing the common differentially expressed genes (padj < 0.05) and mapped novel ATAC-seq peaks in CHD8-A and CHD8-B cell lines. (I) Top five enriched GO processes in CHD8+/− neurons of common genes identified in (H). (J) Cohort analysis of whole-exome data shows that genes with significant changes in gene expression (RNA-seq) or chromatin compaction (ATAC-seq) are enriched with nonsense and/or missense mutations in ASD (n = 3,963 exomes), intellectual disability (n = 151), or schizophrenia (n = 964) cohorts but not in heart disease (n = 1,229), epilepsy (n = 264), or unaffected control (n = 2,303) cohorts. Error bars indicate SEM.

References

    1. Baio J., Wiggins L., Christensen D.L., Maenner M.J., Daniels J., Warren Z., Kurzius-Spencer M., Zahorodny W., Robinson Rosenberg C., White T., et al. Prevalence of autism spectrum disorder among children aged 8 years - autism and developmental disabilities monitoring network, 11 sites, United States, 2014. MMWR. Surveill. Summ. 2018;67:1–23. doi: 10.15585/mmwr.ss6706a1. - DOI - PMC - PubMed
    1. Sandin S., Lichtenstein P., Kuja-Halkola R., Hultman C., Larsson H., Reichenberg A. The heritability of autism spectrum disorder. JAMA. 2017;318:1182–1184. doi: 10.1001/jama.2017.12141. - DOI - PMC - PubMed
    1. Iossifov I., O’Roak B.J., Sanders S.J., Ronemus M., Krumm N., Levy D., Stessman H.A., Witherspoon K.T., Vives L., Patterson K.E., et al. The contribution of de novo coding mutations to autism spectrum disorder. Nature. 2014;515:216–221. doi: 10.1038/nature13908. - DOI - PMC - PubMed
    1. Sanders S.J., He X., Willsey A.J., Ercan-Sencicek A.G., Samocha K.E., Cicek A.E., Murtha M.T., Bal V.H., Bishop S.L., Dong S., et al. Insights into autism spectrum disorder genomic architecture and biology from 71 risk loci. Neuron. 2015;87:1215–1233. doi: 10.1016/j.neuron.2015.09.016. - DOI - PMC - PubMed
    1. Turner T.N., Coe B.P., Dickel D.E., Hoekzema K., Nelson B.J., Zody M.C., Kronenberg Z.N., Hormozdiari F., Raja A., Pennacchio L.A., et al. Genomic patterns of de novo mutation in simplex autism. Cell. 2017;171:710–722.e12. doi: 10.1016/j.cell.2017.08.047. - DOI - PMC - PubMed

Publication types