. 2023 Nov 13;41(11):1911-1926.e8.
doi: 10.1016/j.ccell.2023.09.001. Epub 2023 Oct 5.

TIM-3 blockade in diffuse intrinsic pontine glioma models promotes tumor regression and antitumor immune memory

Affiliations

TIM-3 blockade in diffuse intrinsic pontine glioma models promotes tumor regression and antitumor immune memory

Iker Ausejo-Mauleon et al. Cancer Cell. .

Abstract

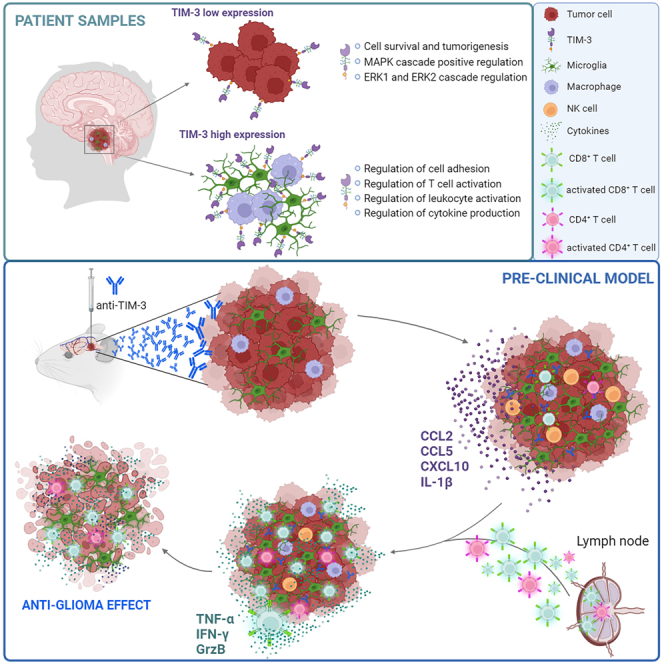
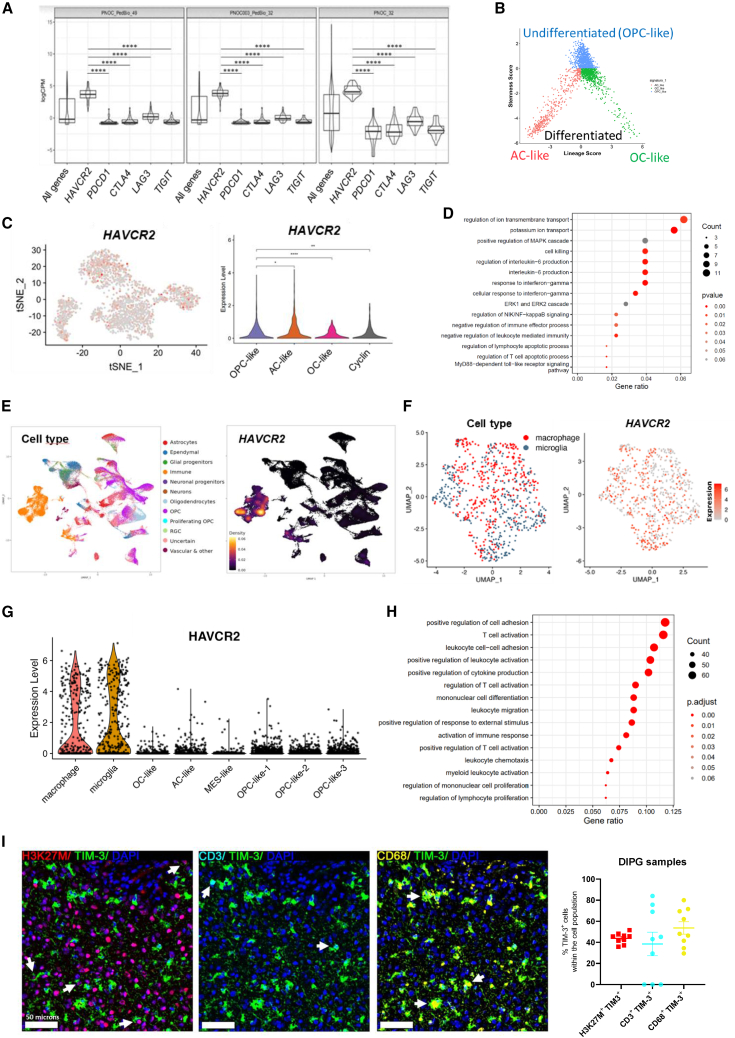
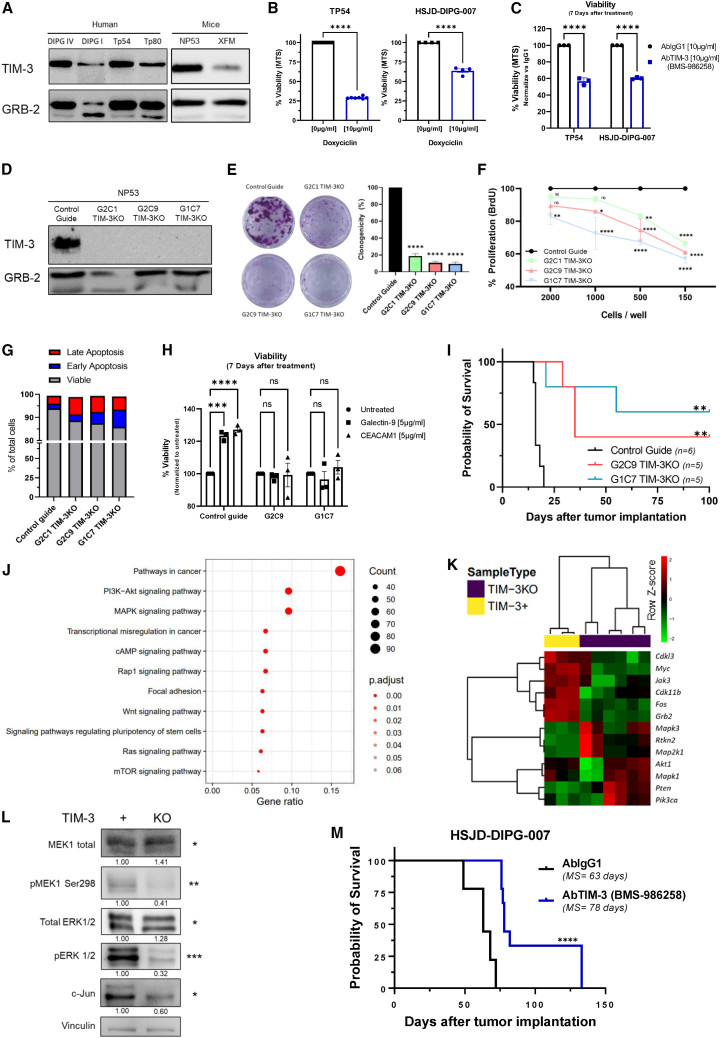
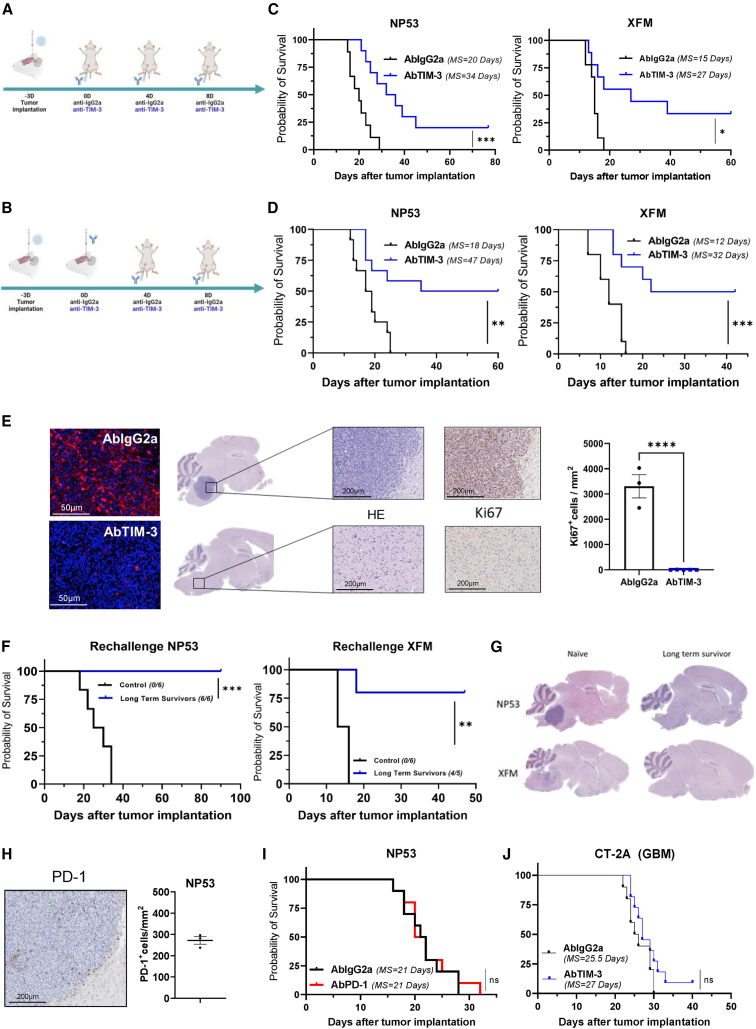
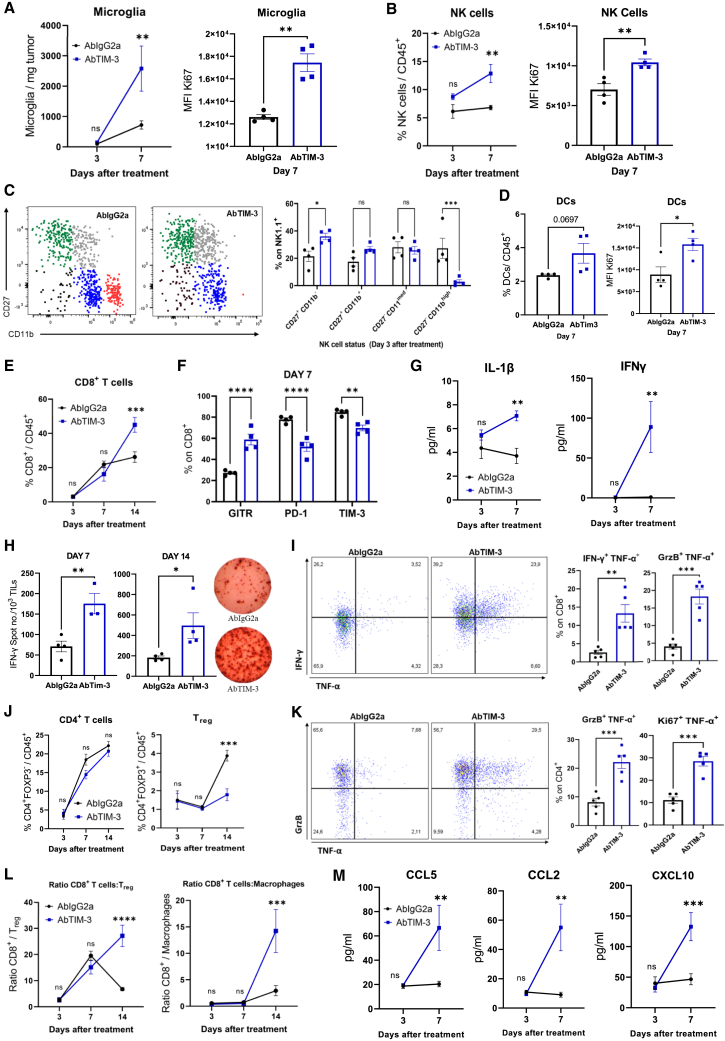
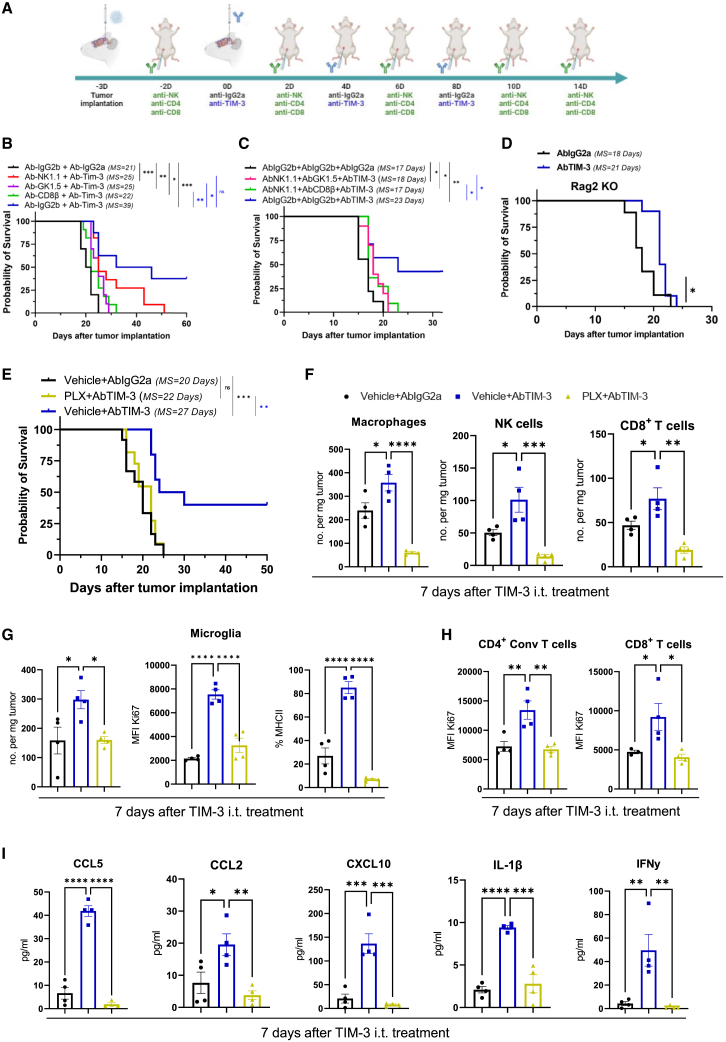
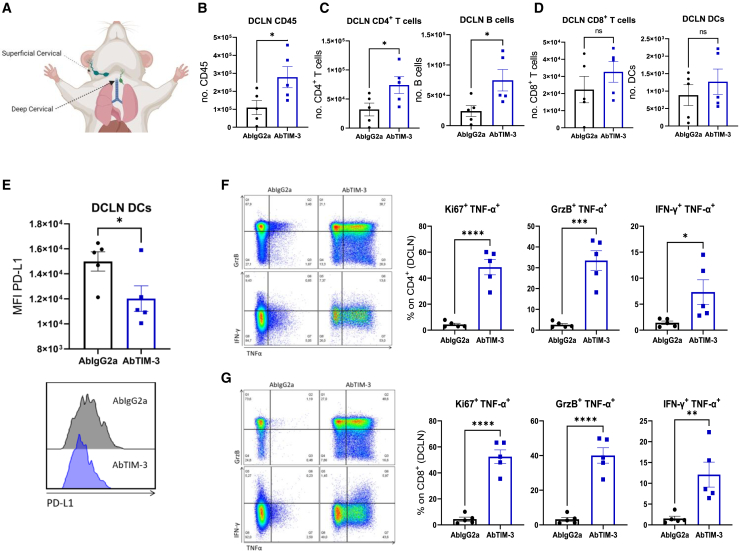
Diffuse intrinsic pontine glioma (DIPG) is an aggressive brain stem tumor and the leading cause of pediatric cancer-related death. To date, these tumors remain incurable, underscoring the need for efficacious therapies. In this study, we demonstrate that the immune checkpoint TIM-3 (HAVCR2) is highly expressed in both tumor cells and microenvironmental cells, mainly microglia and macrophages, in DIPG. We show that inhibition of TIM-3 in syngeneic models of DIPG prolongs survival and produces long-term survivors free of disease that harbor immune memory. This antitumor effect is driven by the direct effect of TIM-3 inhibition in tumor cells, the coordinated action of several immune cell populations, and the secretion of chemokines/cytokines that create a proinflammatory tumor microenvironment favoring a potent antitumor immune response. This work uncovers TIM-3 as a bona fide target in DIPG and supports its clinical translation.

Keywords: DIPG; DMGs; TIM-3; diffuse midline glioma; immune checkpoint; immunotherapy; macrophages; microglia; pediatric brain tumor; tumor microenvironment.


Conflict of interest statement

Declaration of interests A.C.A. is a member of the SAB for Tizona Therapeutics, Trishula Therapeutics, Compass Therapeutics, Zumutor Biologics, ImmuneOncia, and Excepgen, which have interests in cancer immunotherapy. A.C.A. is a paid consultant for iTeos Therapeutics and Larkspur Biosciences. A.C.A.’s interests were reviewed and managed by the Brigham and Women’s Hospital. The rest of authors do not have potential conflicts of interest to disclose.

Figures

None
Graphical abstract
Figure 1
Figure 1
Evaluation of TIM-3 (HAVCR2) expression in samples from DIPG patients (A) Violin plots showing the relative mRNA expression of HAVCR2 (TIM-3), PDCD1 (PD-1), CTLA-4, LAG3, and TIGIT in DIPG patients (n = 113) from the PedcBioPortal (PNOC_PedBio_49 and PNOC003_PedBio_32) and Kids First Data Resource Portal (PNOC_32). The lower and upper hinges of the violin plots correspond to the first and third quartiles. After stat (middle): median, 50% quantile, as well as the kernel density estimates as the width. (B) Two-dimensional representations of the OC-like versus AC-like (x axis) and OPC-like (y axis) scores for DIPG patients. (C) Left panel, tSNE map of TIM-3 expression in OPC-like, AC-like and OC-like cells. Right panel, Violin plot of TIM-3 expression. (D) Gene pathways enriched in the set of genes correlated with TIM-3 in OPC-like cells (tumor cells). (E) Left panel, UMAP plot depicting the different cell populations found in scRNA-seq data for 66 DIPG patients. Right panel, Visualization of HAVCR2 gene expression density in UMAP. (F) UMAP plot of TIM-3 expression in microglia and macrophages from scRNA-seq data. (G) Violin plot of TIM-3 expression in microglia, macrophages, OC-like cells, AC-like cells, MES-like cells and OPC-like cells. (H) Gene pathways enriched in the set of genes correlated with TIM-3 in microglia. Data obtained from a previous patient’s scRNA-seq dataset (GSE18435725). (I) Left panel, representative image from multiplex IF analyses with TIM-3, H3K27M (tumor cells), CD68 (macrophages and microglia) and CD3 (T cells) of DIPG tumor samples from a patient. Right panel, quantification of H3K27M+TIM-3+, H3K27M+TIM-3+, and H3K27M+TIM-3+ compared to total cells in 9 different DIPG patients. One-way ANOVA was performed in panels A and C. Bar graphs indicate the mean ± SEM. (ns, p > 0.05; p < 0.05; ∗∗p < 0.01; ∗∗∗p < 0.001; ∗∗∗∗p < 0.0001). See also Figure S1.
Figure 2
Figure 2
Analysis of the role of TIM-3 in the tumorigenesis of human and murine DIPG cell lines (A) Western blot analysis of TIM-3 expression in DIPG human and murine cell lines, using GRB-2 as a housekeeping protein. (B) Viability assay (MTS) of TP54 and DIPG007 cells 7 days after TIM-3-specific shRNA knockdown. (C) Viability assay (MTS) of TP54 and DIPG007 cells 7 days after treatment with a human anti-TIM-3 antibody (provided by BMS, BMS-986258). (D) Western blot analysis of TIM-3 expression in control guide NP53 and TIM-3KO (G2C1, G2C9, and G1C7) NP53 different cell lines. (E) Clonogenicity assay with control guide NP53 cells versus three different TIM-3KO NP53 clones at 2 weeks. (F) Evaluation of the proliferative capacity by a BrdU assay performed with TIM-3KO clones normalized to control guide cells (mean ± SEM) (G) Apoptosis analysis of TIM-3KO cells compared to control guide cells. Viable (Annexin V7AAD), early apoptosis (Annexin V+7AAD), and late apoptosis (Annexin V+7AAD+). (H) Viability assay (MTS) of NP53 control guide, G2C9 and G1C7 TIM-3KO cells 7 days after treatment with galectin-9 and CEACAM1 (TIM-3 main ligands). (I) Kaplan-Meier survival curves of immunocompetent mice bearing control guide NP53 cells (n = 6), G2C9 TIM-3KO cells (n = 5, log rank; p = 0.0012), or G1C7 TIM-3KO cells (n = 5, log rank; p = 0.0012). (J) Gene pathways enriched in the set of genes with differential expression between TIM-3+ and TIM-3KO cells. Results obtained from RNA-seq data. (K) Heatmap of the differentially expressed genes between TIM-3+ and TIM-3KO cells related to the MAPK and PI3K-AKT pathways. Results were obtained from previous RNA-seq data. (L) Western blot analysis of PTEN, MEK1, pMEK, ERK1/2, pERK1/2, and c-JUN expression in TIM-3+ and TIM-3KO murine DIPG cell lines. Standardized quantification against its own vinculin (housekeeping) and a Student’s t test is performed for TIM-3+ versus TIM-3KO statistical analysis. (M) Kaplan-Meier survival curves of immunocompetent mice bearing HSJD-007 tumors and treated with an anti-human TIM-3 antibody (BMS-986258) (n = 9) or IgG1 (n = 9 log rank; p = 0.0001). Student’s t test (panel B, C), one-way ANOVA (panel E) and two-way ANOVA (panel F, H) were performed. Bar graphs indicate the mean ± SEM. (ns, p > 0.05; p < 0.05; ∗∗p < 0.01; ∗∗∗p < 0.001; ∗∗∗∗p < 0.0001). See also Figures S2 and S3.
Figure 3
Figure 3
Evaluation of the antitumor effect of TIM-3 blockade (A and B) Schedule of survival experiments performed with murine DIPG cells. Cells were implanted on Day -3. On Day 0 (three days later), 25 μg of IgG2a or anti-TIM-3 was administered intraperitoneally (i.p.) in the systemic schedule (A) or intratumorally (i.t.) in the hybrid schedule (B). On Days 7 and 11 days after cell implantation, each of the antibodies (10 mg/kg) was administered intraperitoneally (i.p.). (C) Kaplan-Meier survival curves of mice bearing NP53 (n = 10 per group, log rank; p = 0.0008) or XFM (n = 10 per group, log rank; p = 0.0102) DIPG cells systemically treated with IgG2a or anti-TIM-3 monoclonal antibodies. (D) Kaplan-Meier survival curves of mice bearing NP53 (n = 12 per group, log rank; p = 0.0025) or XFM (n = 10 per group, log rank; p = 0.0008) cells treated with the hybrid schedule. (E) Left panel, representative images of TIM-3 expression levels in the tumors of mice treated with IgG2a or anti-TIM-3. Middle panel, representative hematoxylin/eosin and Ki67 staining micrographs of NP53 tumors from mice given the indicated treatments. Right panel, quantification of Ki67+ cells in the tumors of mice treated with IgG2a (n = 3) or anti-TIM-3 (n = 5) (p < 0.0001). Student’s t test was performed. Bar graphs indicate the mean ± SEM. (ns, p > 0.05; p < 0.05; ∗∗p < 0.01; ∗∗∗p < 0.001; ∗∗∗∗p < 0.0001). (F) The long-term survivors in the anti-TIM-3-treated group from (B) were subjected to rechallenge with NP53 (n = 6) or XFM (n = 5) cells and compared with control naive mice (n = 6) (p = 0.0001 and 0.0002, for NP53 tumor- and XFM tumor-bearing mice, respectively). (G) Representative hematoxylin/eosin staining images of NP53 or XFM tumors harvested from mice at the time of death (naive) or at the end of the experiment (long-term survivors). (H) Left panel, representative images of PD-1 expression levels in NP53. Right panel, quantification of PD-1+ cells per mm2 of NP53 tumors. (I) Kaplan-Meier survival curves of mice treated with an anti-PD-1 or IgG2A monoclonal antibody (n = 10, log rank; p = 0.71) following the schedule depicted in (B). (J) Kaplan‒Meier survival curves of mice bearing CT-2A cells treated with an anti-TIM-3 or IgG2A monoclonal antibody (n = 10, log rank; p = 0.143) following the systemic schedule depicted in (A). See also Figures S4 and S5.
Figure 4
Figure 4
Characterization of tumor microenvironment modulation by TIM-3 blockade NP53 cells were engrafted (Day -3), and animals were treated with IgG2a or anti-TIM-3 (Day 0) following the hybrid schedule depicted in Figure 3B. Animals were sacrificed on days 3, 7, and 14 after treatment (A). Left panel, flow cytometric analyses of microglia per mg of tumor on days 3 and 7 after i.t. treatment. Right panel, quantification of Ki67+ microglia by flow cytometry on day 7 after i.t. treatment (p = 0.001) (B) Left panel, flow cytometric analyses of the NK-cell percentage. Right panel, Ki67 expression on NK cells at the indicated days after i.t. treatment with IgG2a or anti-TIM-3. (C) Analyses of the NK-cell status using the markers CD27 and CD11b on Day 3 after i.t. treatment. CD27+CD11b (green), CD27+CD11b+ (gray), CD27CD11bmed (blue), and CD27+CD11bhigh (red). Left panel, representative flow cytometry plots. Right panel, quantification of the indicated markers (p = 0.0007). (D) Left panel, flow cytometric analyses of the DC percentage. Right panel, Ki67 expression on DCs at 7 days after i.t. treatment. (E) Flow cytometric analyses of the CD8+ T cell percentage in the CD45+ population on days 3, 7, and 14 after i.t. treatment. (F) Flow cytometric analyses of different activation (GITR, p < 0.0001) and exhaustion (PD1, p < 0.0001; TIM-3, p = 0.009) markers expressed in the CD8+ subset on day 7 after treatment administration. (G) Quantification of IL-1β and IFN-γ expression in the tumor parenchyma on days 3 and 7 (p < 0.001, both) after i.t. treatment. H) ELISPOT analyses of TILs on Days 7 and 14 after i.t. IgG2a or anti-TIM-3 treatment (p < 0.001 and p = 0.04, respectively) (I) Flow cytometric analysis of IFN-γ, TNF-α, and GrzB expression after ex vivo stimulation of CD8+ TILs treated with IgG2a or anti-TIM-3 (p < 0.001, all). (J) Analyses of the CD4+ and Treg percentages in the CD45+ cell population on days 3, 7, and 14 after i.t. treatment with IgG2a or anti-TIM-3. (K) Flow cytometric analysis of Ki67, TNF-α, and GrzB expression after ex vivo stimulation of CD4+ TILs treated with IgG2a or anti-TIM-3 (p < 0.001, all). (L) Analyses of the CD8+ cell:Treg (p < 0.0001) and CD8+ cell:macrophage (p < 0.001) ratios in the tumor microenvironment population on the indicated days. (M) Flow cytometric analysis of CCL2, CCL5, and CXCL10 expression in the tumor microenvironment on the indicated days. Student’s t test, one-way ANOVA and two-way ANOVA were performed. Bar graphs indicate the mean ± SEM (ns, p > 0.05; p < 0.05; ∗∗p < 0.01; ∗∗∗p < 0.001; ∗∗∗∗p < 0.0001). See also Figure S6.
Figure 5
Figure 5
Characterization of the roles of different immune populations in TIM-3-blockade efficacy (A) Schedule of survival experiments (NP53 cells bearing mice) performed with depleting antibodies specific for NK cells (clone K1.1), CD4+ T cells (clone GK1.5), and CD8+ T cells (clone CD8β) and anti-TIM-3 or IgG2a antibodies. (B and C) Kaplan-Meier survival curves of mice treated with the anti-TIM-3 antibody and (B) depleting antibody specific for NK cells (n = 11), CD4 cells (n = 10), or CD8 cells (n = 11) alone or in combination (C) of NK and CD4+ T cells (n = 10) or NK and CD8+ T cells (n = 11). (D) Kaplan-Meier survival curves of immunodeficient Rag2-γc- mice treated with anti-TIM-3 (n = 10) or IgG2a (n = 9) (log rank p = 0.01). (E) Kaplan-Meier survival curves of mice treated with anti-TIM-3 (n = 10) or IgG2a (n = 12) or an anti-CSFR1 drug (PLX) plus the anti-TIM-3 antibody (n = 11). (F) Flow cytometric analyses of macrophages, NK and CD8+ T cells per mg of tumor on day 7 after TIM-3 i.t. treatment with Vehicle+IgG2a (black), Vehicle+AbTIM-3 (blue), or PLX+AbTIM-3 (yellow). (G) Flow cytometric analyses of microglia number of cells per mg tumor (left panel), MFI Ki67 (middle panel), and percentage of MHCII expression (right panel) on day 7. (H) Quantification of Ki67+ CD4+ (left panel) and CD8+ T cells (right panel) by flow cytometry on day 7 after i.t. treatment. (I) Flow cytometric analysis of CCL2, CCL5, CXCL10, IL-1β, and IFN-γ expression in the tumor microenvironment comparing groups on the indicated day. One-way ANOVA was performed. Bar graphs indicate the mean ± SEM (ns, p > 0.05; p < 0.05; ∗∗p < 0.01; ∗∗∗p < 0.001; ∗∗∗∗p < 0.0001). See also Figures S7 and S8.
Figure 6
Figure 6
Assessment of the role of the deep cervical tumor-draining lymph nodes in TIM-3 blockade (A) Representative diagram of where the superior cervical (SC LN) and deep cervical lymph nodes (DC LN) are located. (B) Flow cytometric analyses of the number of CD45+ immune cells in the DC LN on day 7 after i.t. treatment with IgG2a (black) or anti-TIM-3 (blue). (C and D) Flow cytometric analyses of the numbers of (C) CD4+ T, B cells, (D) CD8+ T cells, and DCs in the DC LN on day 7 after i.t. treatment. (E) MFI analysis of PD-L1 expression in DCs in the tumor-draining DC LN on Day 7 after treatment. (F and G) Left panels, representative flow cytometry plots. Right panels, flow cytometric analysis of Ki67+, TNF-α+, GrzB+, and IFN-γ+ expression after ex vivo stimulation of (F) CD4+ or (G) CD8+ cells from the DC LN of mice treated with IgG2a or anti-TIM-3. Student’s t test was performed in all the graphs. Bar graphs indicate the mean ± SEM (ns, p > 0.05; p < 0.05; ∗∗p < 0.01; ∗∗∗p < 0.001; ∗∗∗∗p < 0.0001). See also Figure S9.

Comment in

References

    1. Louis D.N., Perry A., Wesseling P., Brat D.J., Cree I.A., Figarella-Branger D., Hawkins C., Ng H.K., Pfister S.M., Reifenberger G., et al. The 2021 WHO classification of tumors of the central nervous system: A summary. Neuro Oncol. 2021;23:1231–1251. - PMC - PubMed
    1. Cooney T., Lane A., Bartels U., Bouffet E., Goldman S., Leary S.E.S., Foreman N.K., Packer R.J., Broniscer A., Minturn J.E., et al. Contemporary survival endpoints: An international diffuse intrinsic pontine glioma registry study. Neuro Oncol. 2017;19:1279–1280. - PMC - PubMed
    1. Hoffman L.M., Veldhuijzen van Zanten S.E.M., Colditz N., Baugh J., Chaney B., Hoffmann M., Lane A., Fuller C., Miles L., Hawkins C., et al. Clinical, radiologic, pathologic, and molecular characteristics of long-term survivors of Diffuse Intrinsic Pontine Glioma (DIPG): A collaborative report from the International and European Society for Pediatric Oncology DIPG registries. J. Clin. Oncol. 2018;36:1963–1972. - PMC - PubMed
    1. Mackay A., Burford A., Carvalho D., Izquierdo E., Fazal-Salom J., Taylor K.R., Bjerke L., Clarke M., Vinci M., Nandhabalan M., et al. Integrated Molecular Meta-Analysis of 1,000 Pediatric High-Grade and Diffuse Intrinsic Pontine Glioma. Cancer Cell. 2017;32:520–537.e5. - PMC - PubMed
    1. El-Khouly F.E., Veldhuijzen van Zanten S.E.M., Santa-Maria Lopez V., Hendrikse N.H., Kaspers G.J.L., Loizos G., Sumerauer D., Nysom K., Pruunsild K., Pentikainen V., et al. Diagnostics and treatment of diffuse intrinsic pontine glioma: where do we stand? J. Neuro Oncol. 2019;145:177–184. - PMC - PubMed

Publication types

Substances