. 2023 Nov 14;18(11):2123-2137.
doi: 10.1016/j.stemcr.2023.09.002. Epub 2023 Oct 5.

Human model of primary carnitine deficiency cardiomyopathy reveals ferroptosis as a novel mechanism

Affiliations

Human model of primary carnitine deficiency cardiomyopathy reveals ferroptosis as a novel mechanism

Malte Loos et al. Stem Cell Reports. .

Abstract

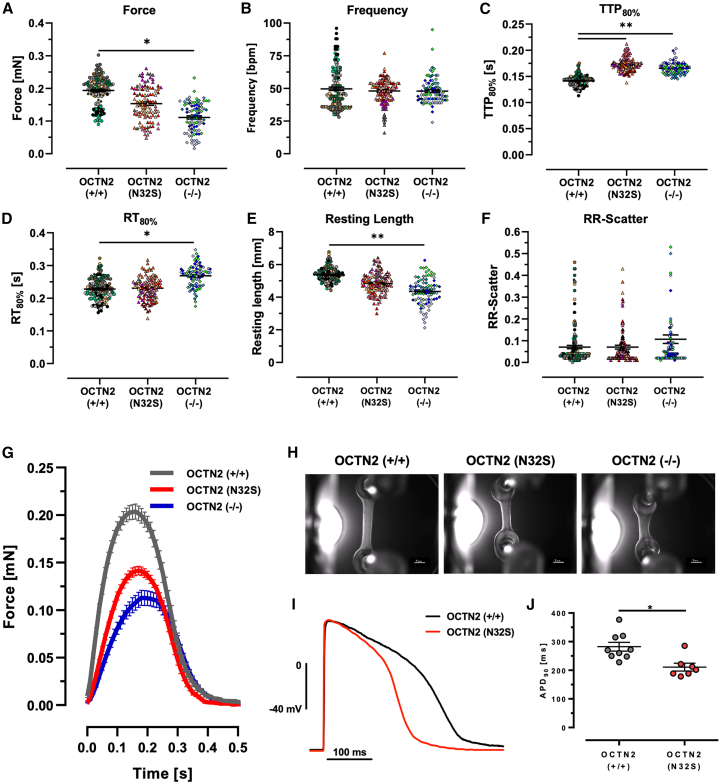
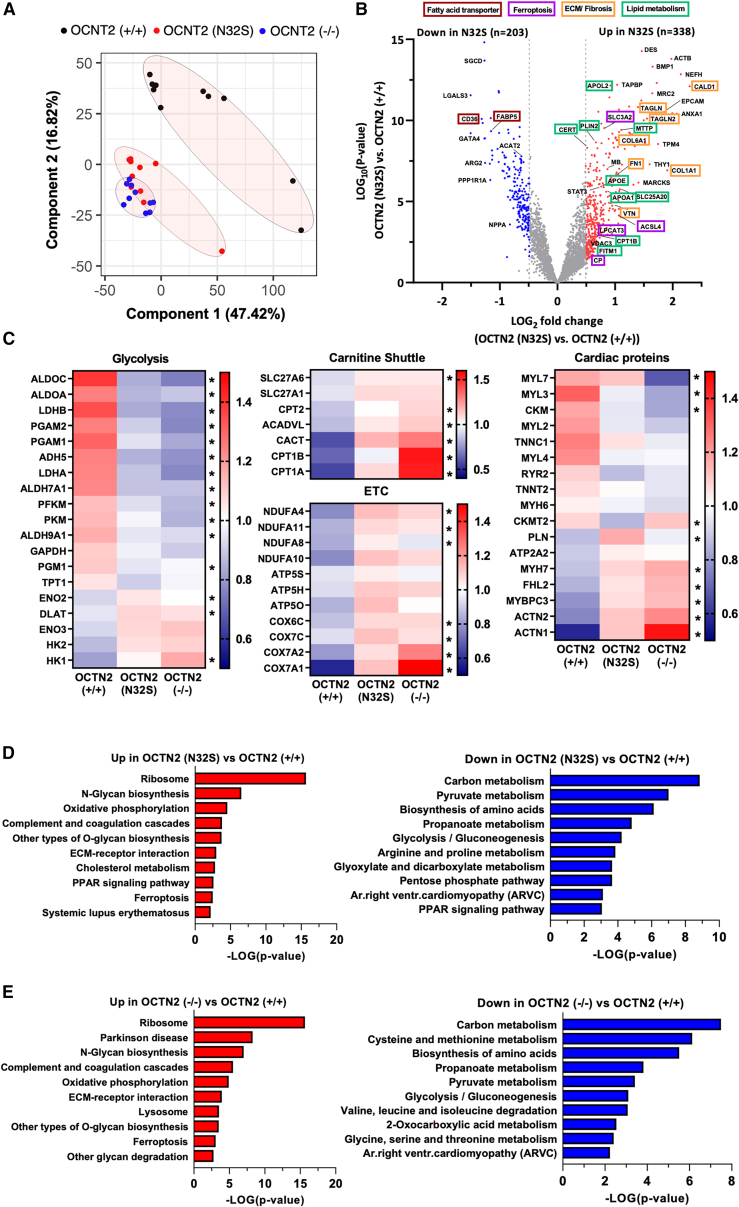
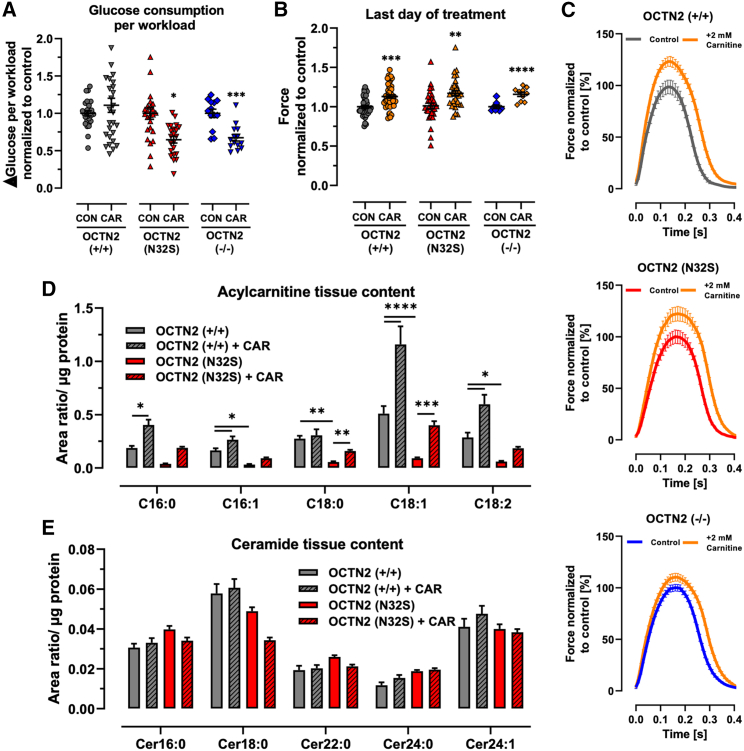
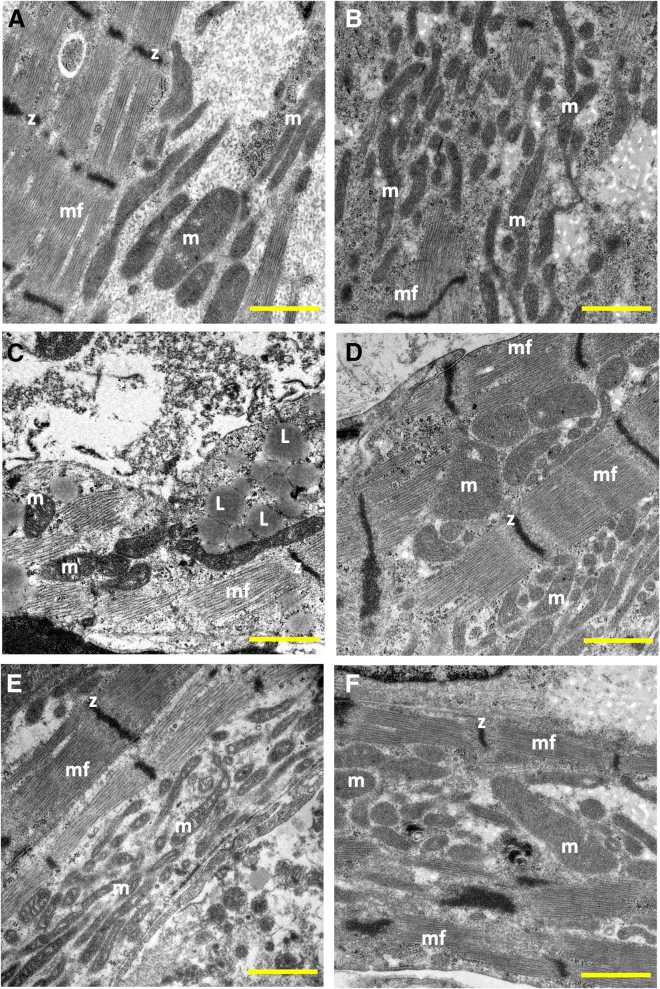
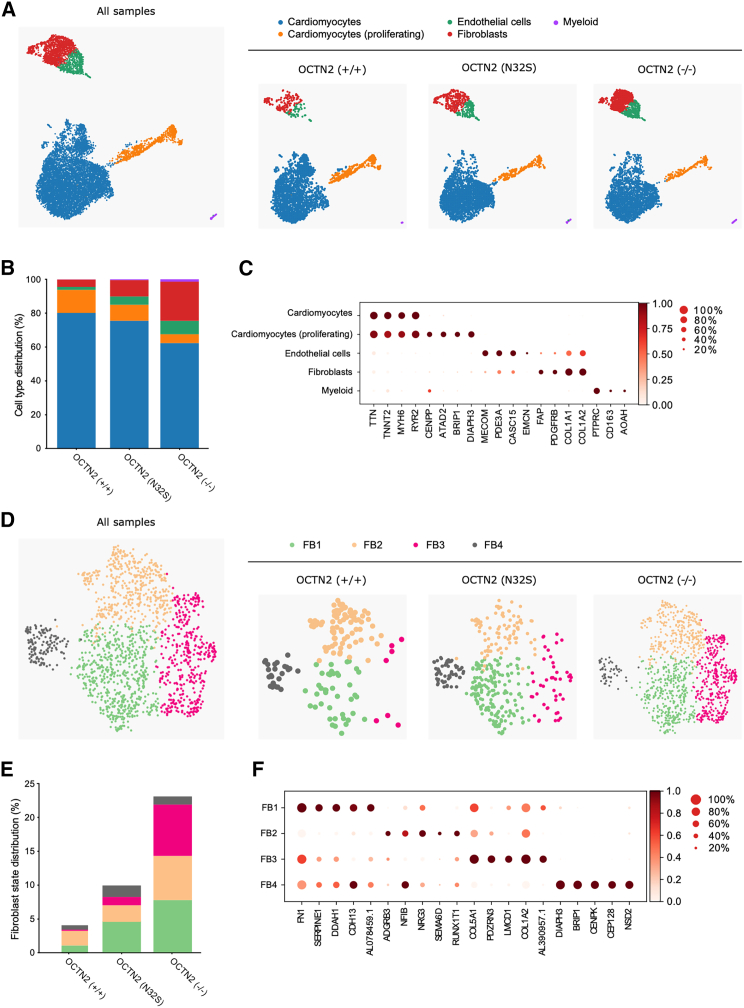
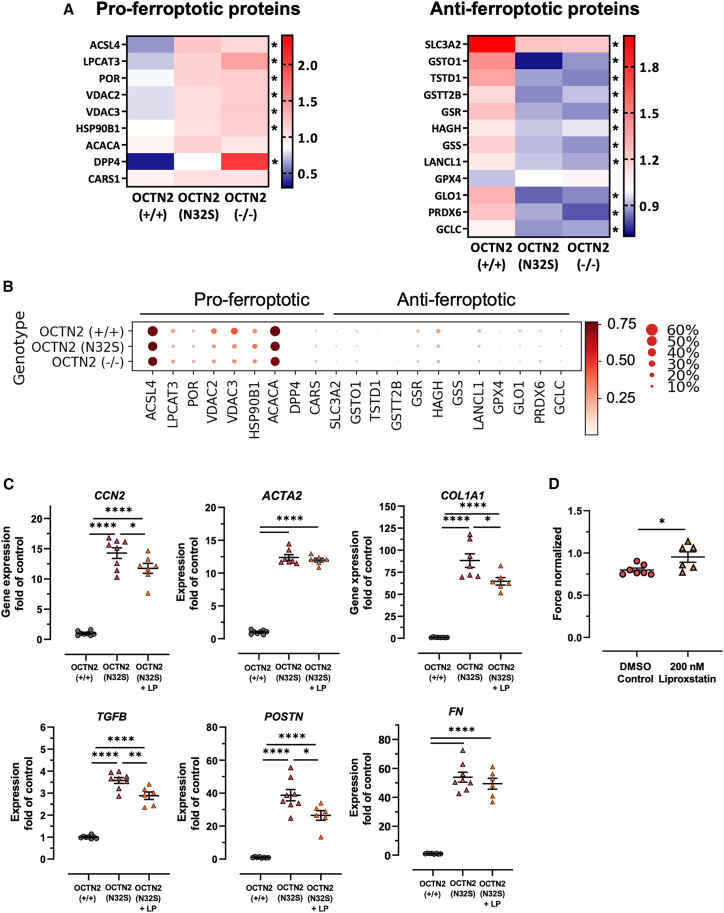
Primary carnitine deficiency (PCD) is an autosomal recessive monogenic disorder caused by mutations in SLC22A5. This gene encodes for OCTN2, which transports the essential metabolite carnitine into the cell. PCD patients suffer from muscular weakness and dilated cardiomyopathy. Two OCTN2-defective human induced pluripotent stem cell lines were generated, carrying a full OCTN2 knockout and a homozygous OCTN2 (N32S) loss-of-function mutation. OCTN2-defective genotypes showed lower force development and resting length in engineered heart tissue format compared with isogenic control. Force was sensitive to fatty acid-based media and associated with lipid accumulation, mitochondrial alteration, higher glucose uptake, and metabolic remodeling, replicating findings in animal models. The concordant results of OCTN2 (N32S) and -knockout emphasizes the relevance of OCTN2 for these findings. Importantly, genome-wide analysis and pharmacological inhibitor experiments identified ferroptosis, an iron- and lipid-dependent cell death pathway associated with fibroblast activation as a novel PCD cardiomyopathy disease mechanism.

Keywords: Cardiomyocytes; Dilated Cardiomyopathy; Metabolism; disease modeling; iPSC.


Conflict of interest statement

Declaration of interests T.E. is a member of the DiNAQOR Scientific Advisory Board and holds shares in DiNAQOR.

Figures

None
Graphical abstract
Figure 1
Figure 1
Contractile phenotype of OCTN2 genotypes (A–H) Effect of OCTN2 genotype on contractile parameters of spontaneous beating EHTs on day 21. OCNT2 (+/+), n = 153 EHTs from 9 batches; OCTN2 (N32S), n = 108 EHTs from 7 batches; OCTN2 (−/−), n = 91 EHTs from 5 batches. Nested one-way ANOVA followed by Bonferroni’s post test for multiple comparisons, p < 0.05, ∗∗p < 0.01, ∗∗∗p < 0.001, ∗∗∗∗p < 0.0001. Each data point represents one EHT. Each color represents one independent differentiation batch. Data are expressed as mean ± SEM. (G) Representative average EHT contraction peaks of OCTN2 (+/+), OCTN2 (N32S), and OCTN2 (−/−). EHTs were electrically paced at 1.5 Hz in standard EHT medium, n = 9–14 EHTs from one batch. (H) Representative video-optical EHT images. Scale bars, 1 mm. (I and J) (I) Action potential measurement: representative action potential for OCTN2 (+/+) and OCTN2 (N32S). (J) Action potential duration (APD90) of OCTN2 (+/+) and OCTN2 (N32S) by sharp microelectrode measurement at 1.5 Hz. Student’s t test vs. OCTN2 (+/+), p < 0.05. Data are expressed as mean ± SEM. Each data point represents one EHT. See also Figure S3.
Figure 2
Figure 2
Effect of input cell compostion and cell culture media on EHT properties (A and B) Pearson correlation of (A) force and (B) resting length of EHTs with percentage of cTNT-positive input cells for EHT generation. OCTN2 (+/+), n = 10; OCTN2 (N32S), n = 7; OCTN2 (−/−), n = 7 differentiation batches. Each replicate represents the mean value of 7–20 EHTs for the specific differentiation batch. (C) EHT force development in fatty acid medium. Serum-free cell culture medium was supplemented with 50 μM carnitine, linoleic acid- and oleic acid-albumin. Data are normalized to baseline force. OCNT2 (+/+), n = 11 EHTs from 2 batches; OCTN2 (N32S), n = 11 EHTs from 2 batches; OCTN2 (−/−), n = 12 EHTs from 2 batches. Two-way ANOVA vs. OCNT2 (+/+) followed by Bonferroni’s post test for multiple comparisons, p < 0.05. Data are expressed as mean ± SEM. (D) Difference in ΔGlucose medium concentration divided by product of individual spontaneous beating frequency × force. ΔGlucose = glucose concentration at baseline minus glucose concentration after 24 h of incubation in medium containing 5.5 mM glucose and 10% horse serum. OCNT2 (+/+), n = 59 EHTs from 5 batches; OCTN2 (N32S), n = 51 EHTs from 4 batches; OCTN2 (−/−), n = 28 EHTs from 4 batches. One-way ANOVA followed by Bonferroni’s post test for multiple comparisons, p < 0.05, ∗∗p < 0.01, ∗∗∗p < 0.001, ∗∗∗∗p < 0.0001. One data point represents one EHT. Data are expressed as mean ± SEM. See also Figure S3.
Figure 3
Figure 3
Tandem mass tag-based quantitative proteomic analysis of EHTs (A) Principal-component analysis (PCA) of OCNT2 (+/+) (black, n = 10) OCTN2 (N32S) (red, n = 10), and OCTN2 (−/−) (blue, n = 10) EHTs based on their proteomic profiles. Each dot represents one EHT. (B) Volcano plot of log2 fold changes of OCTN2 (N32S) vs. OCTN2 (+/+) and log10 of the p values with color-coded significance levels (p > 0.05) and fold change >1.4. (C) Clustering analysis of proteins related to metabolic pathways and the myocardium. Heatmaps display the relative abundance of proteins involved in glycolysis, carnitine shuttle, electron transport chain (ETC), and the myocardium. OCNT2 (+/+), mean of 10 EHTs from 1 batch; OCTN2 (N32S), mean of 10 EHTs from 1 batch; OCTN2 (−/−), mean of 10 EHTs from 1 batch. Protein levels are depicted as a color code ranging from blue (low abundance) to red (high abundance). Kruskal-Wallis test, indicates statistically significant difference of OCTN2 (+/+) against OCTN2 (N32S) or OCTN2 (−/−). (D and E) Pathway enrichment analysis of proteins identified by proteomic analysis. Depicted are KEGG pathways of significantly enriched proteins that were significantly higher (red) or lower (blue) abundant in (D) OCTN2 (N32S) vs. OCTN2 (+/+) and (E) OCTN2 (−/−) vs. OCTN2 (+/+), p < 0.05, fold change >1.4. See also Figure S4.
Figure 4
Figure 4
Effect of carnitine medium supplementation on EHT properties (A) Effect of carnitine supplementation ΔGlucose per workload (ΔGlucose = Glucose concentration at baseline minus glucose concentration after 24 h of incubation; workload = force × frequency). Nested t test vs. CON, ∗∗p < 0.01, ∗∗∗p < 0.001, ∗∗∗∗p < 0.0001. OCNT2 (+/+) control, n = 27 EHTs from 3 batches; OCNT2 (+/+) + carnitine (2 mM), n = 28 EHTs from 3 batches; OCTN2 (N32S) control, n = 23 EHTs from 3 batches; OCTN2 (N32S) + carnitine (2 mM), n = 23 EHTs from 3 batches; OCTN2 (−/−) control, n = 13 EHTs from 3 batches; OCTN2 (−/−) + carnitine (2 mM), n = 16 EHTs from 3 batches. Data are expressed as mean ± SEM. (B) Effect of carnitine supplementation on force of spontaneous beating EHTs at the last day of treatment (days 33-42). Values were normalized to last day of treatment of untreated control. Student’s t test vs. CON, ∗∗p < 0.01, ∗∗∗p < 0.001, ∗∗∗∗p < 0.001. OCNT2 (+/+) control, n = 54 EHTs from 4 batches; OCNT2 (+/+) + carnitine (2 mM), n = 49 EHTs from 4 batches; OCTN2 (N32S) control, n = 36 EHTs from 3 batches; OCTN2 (N32S) + carnitine (2 mM), n = 33 EHTs from 3 batches; OCTN2 (−/−) control, n = 9 EHTs from 1 batch; OCTN2 (−/−) + carnitine (2 mM), n = 9 EHTs from 1 batch. Data are expressed as mean ± SEM. (C) Effect of carnitine supplementation on average contraction peaks. Depicted are representative average EHT contraction peaks of OCTN2 (+/+), OCTN2 (N32S), and OCTN2 (−/−). EHTs were electrically paced at 1.5 Hz in standard EHT medium ± carnitine (2 mM). Values were normalized to untreated control. n = 9–16 EHTs per condition from 1 batch. (D and E) Liquid chromatography-mass spectrometry analysis of acylcarnitines and ceramides. Effect of carnitine supplementation on (D) acylcarnitine and (E) ceramide content of OCNT2 (+/+) and OCTN2 (N32S) EHTs after 33 days of culture and supplementation. Two-way ANOVA followed by Bonferroni’s post test for multiple comparisons, p < 0.05, ∗∗p < 0.01, ∗∗∗p < 0.001, ∗∗∗∗p < 0.0001. Data are expressed as mean ± SEM. n = 4 EHT pools (containing 3 EHTs each) per genotype and carnitine supplementation from 1 batch. See also Figure S5.
Figure 5
Figure 5
Transmission electron microscopy of OCTN2 EHTs (A and B) OCTN2 (+/+), (C and D) OCTN2 (N32S), and (E and F) OCTN2 (−/−). (A, C, and E) Untreated. (B, D, and F) Supplemented with carnitine (2 mM). mf, myofilaments; z, z-line; m, mitochondria; L, lipid droplet. Scale bars, 1 μm. See also Figure S4.
Figure 6
Figure 6
Cellular heterogeneity in OCTN2 genotypes in EHTs (A) Representative UMAP plot after snRNA-seq of all samples and individual genotypes, n = 1 EHT pool (4 EHTs) per genotype; OCTN2 (+/+) (3,674 cells), OCTN2 (N32S) (4,525 cells), OCTN2 (−/−) (5,108 cells). Five distinct cell clusters were identified: cardiomyocytes, cardiomyocytes (proliferating), endothelial cells, fibroblasts, and myeloid cells. (B) Percentage of cell types per genotype. (C) Dot plot graph showing the relative expression of cell-specific marker genes. Expression levels are depicted as a color code ranging from light red (low expression) to dark red (high expression) as mean of log2 fold of expression. The dot size indicates the percentage of cells expressing the gene. (D) Representative fibroblast subcluster FB1-4 UMAP plot of all samples and individual genotypes. (E) Percentage of fibroblast states per genotype. For each genotype, the total percentage of fibroblast states equals the percentage of fibroblast abundance identified in (B). (F) Dot plot graph showing the relative expression of fibroblast-specific marker genes in fibroblast states. Scaled expression levels are depicted as a color code ranging from light red (low expression) to dark red (high expression) as mean of log2 fold of expression. The dot size indicates the percentage of cells expressing the gene. See also Figures S6 and S7.
Figure 7
Figure 7
Evidence for ferroptosis pathway activation in tandem mass tag-based quantitative proteomic analysis and pharmacological inhibitor experiments (A) Proteomic analysis heatmaps display the relative abundance of pro- and anti-ferroptotic proteins of all genotypes. OCNT2 (+/+), mean of 10 EHTs from 1 batch; OCTN2 (N32S), mean of 10 EHTs from 1 batch; OCTN2 (−/−), mean of 10 EHTs from 1 batch. Protein levels are depicted as a color code ranging from blue (low abundance) to red (high abundance). (B) snRNA-seq dot plot graph showing the scaled relative expression of pro- and anti-ferroptotic markers across all genotypes for all cells. The dot size indicates the percentage of cells expressing the respective gene. (C) Effect of the ferroptosis inhibitor liproxstatin: qPCR analysis gene expression of genes related to fibroblast activation. Gene expression was normalized to GUSB over OCTN2 (+/+) control. OCNT2 (+/+), n = 8 EHTs from 1 batch; OCTN2 (N32S), n = 8 EHTs from 2 batches; OCTN2 (−/−), n = 6–8 EHTs from 1 batch. One-way ANOVA followed by Bonferroni’s post test for multiple comparisons, p < 0.05, ∗∗p < 0.01, ∗∗∗∗p < 0.0001. Data are expressed as mean ± SEM. (D) Effect of liproxstatin (200 nM) on contractile force in OCTN2 (N32S) EHTs. Data are expressed as mean ± SEM, p < 0.05, unpaired t test. See also Figure S7.

References

    1. Alesci S., Manoli I., Costello R., Coates P., Gold P.W., Chrousos G.P., Blackman M.R. Carnitine: Lessons from one hundred years of research. Ann. N. Y. Acad. Sci. 2004;1033
    1. Asai T., Okumura K., Takahashi R., Matsui H., Numaguchi Y., Murakami H., Murakami R., Murohara T. Combined therapy with PPARα agonist and l-carnitine rescues lipotoxic cardiomyopathy due to systemic carnitine deficiency. Cardiovasc. Res. 2006;70:566–577. - PubMed
    1. Bandet C.L., Hajduch E. CERT-Dependent Ceramide Transport, A Crucial Process in Cells. J Diabetes Clin Res. 2021;3:40–45.
    1. Breckwoldt K., Letuffe-Brenière D., Mannhardt I., Schulze T., Ulmer B., Werner T., Benzin A., Klampe B., Reinsch M.C., Laufer S., et al. Differentiation of cardiomyocytes and generation of human engineered heart tissue. Nat. Protoc. 2017;12:1177–1197. - PubMed
    1. Broderick T.L., Panagakis G., DiDomenico D., Gamble J., Lopaschuk G.D., Shug A.L., Paulson D.J. L-carnitine improvement of cardiac function is associated with a stimulation in glucose but not fatty acid metabolism in carnitine-deficient hearts. Cardiovasc. Res. 1995;30:815–820. - PubMed

Supplementary concepts