. 2023 Nov 7;35(11):2077-2092.e6.
doi: 10.1016/j.cmet.2023.09.002. Epub 2023 Oct 5.

Comprehensive quantification of metabolic flux during acute cold stress in mice

Affiliations

Comprehensive quantification of metabolic flux during acute cold stress in mice

Marc R Bornstein et al. Cell Metab. .

Abstract

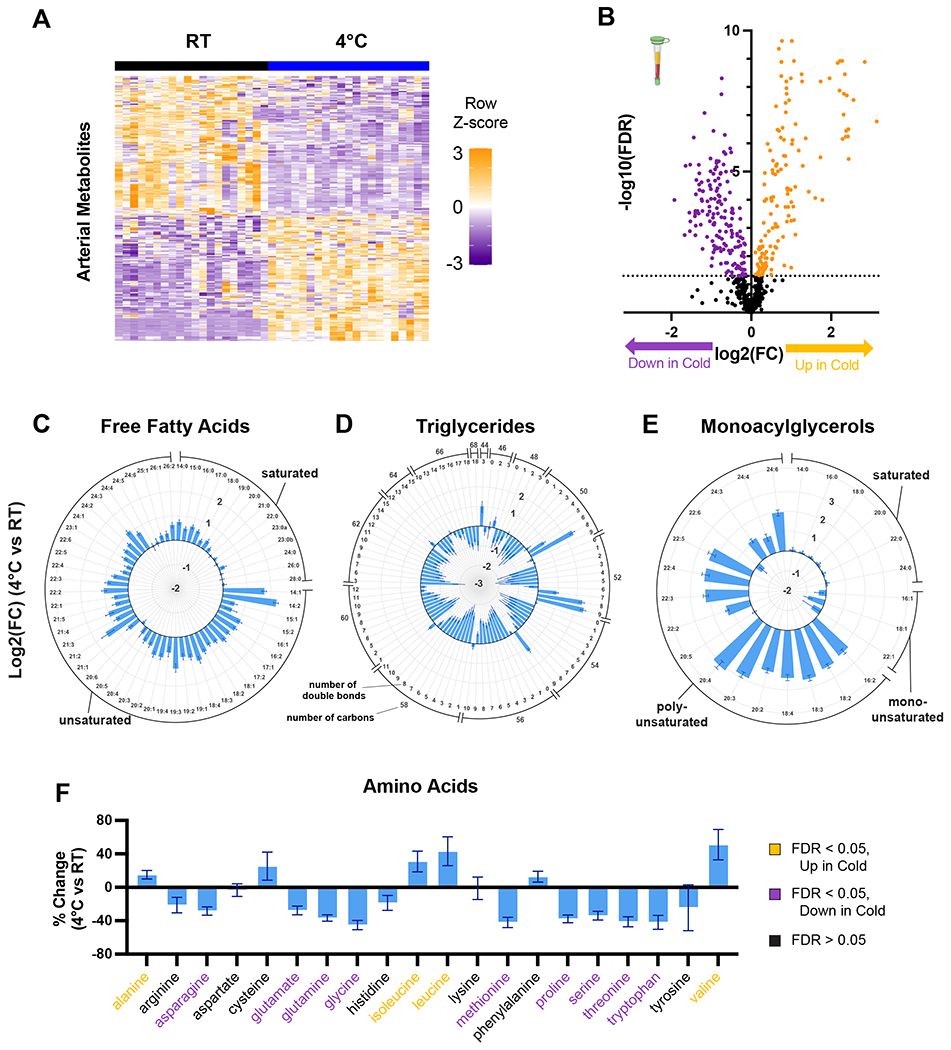
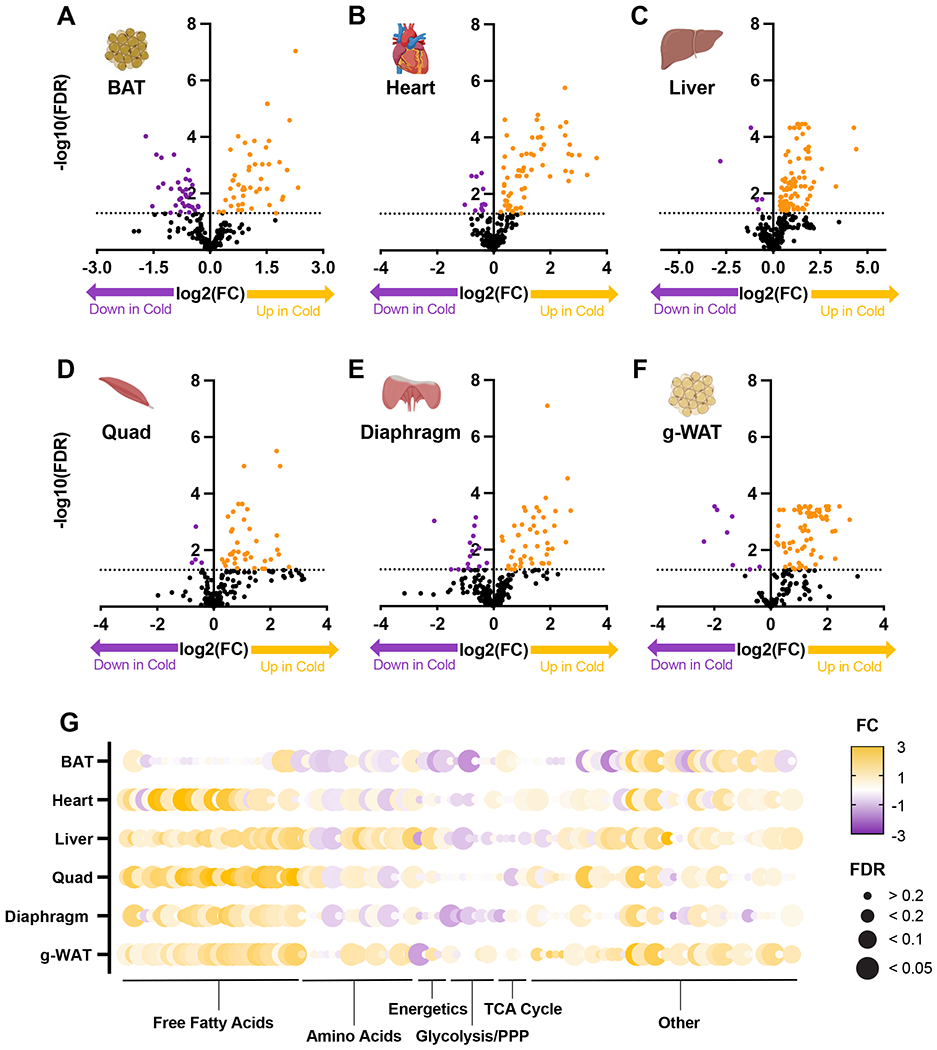
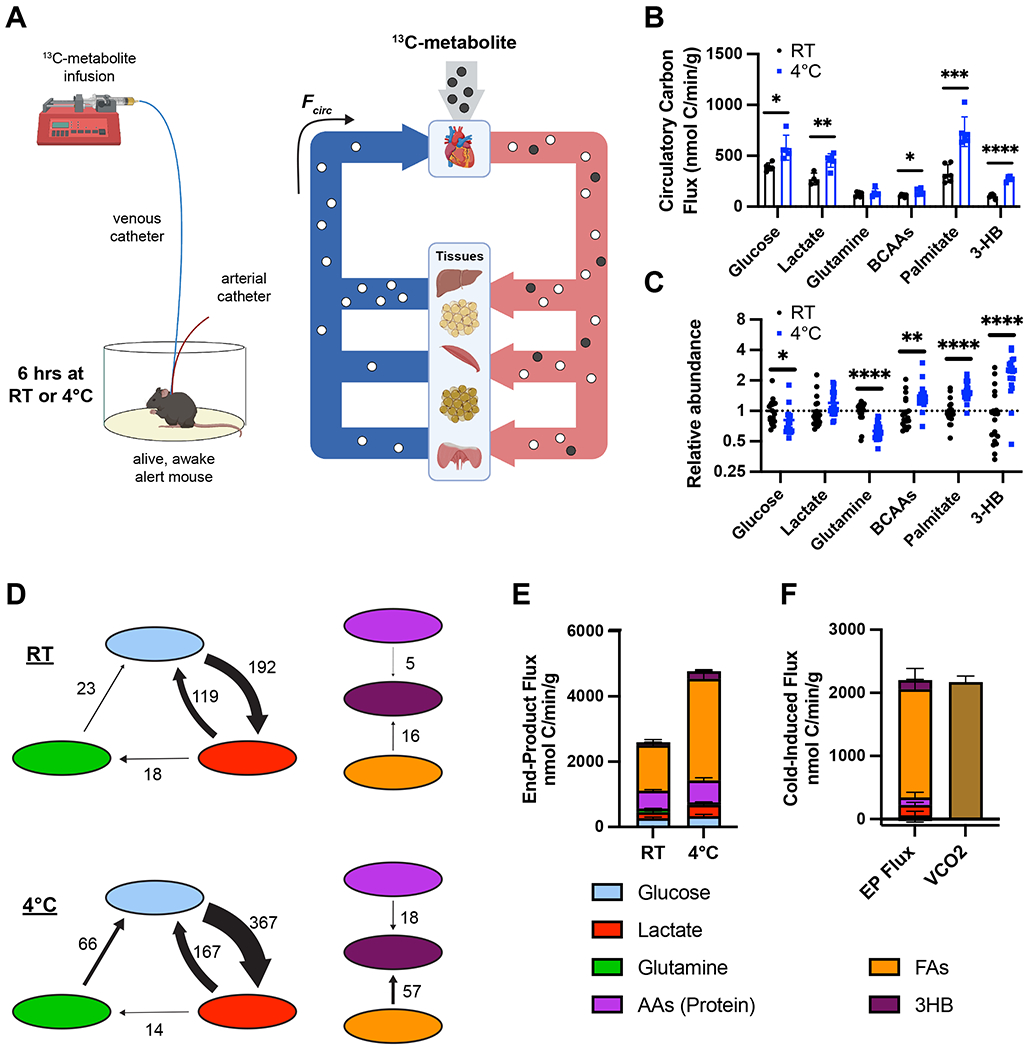
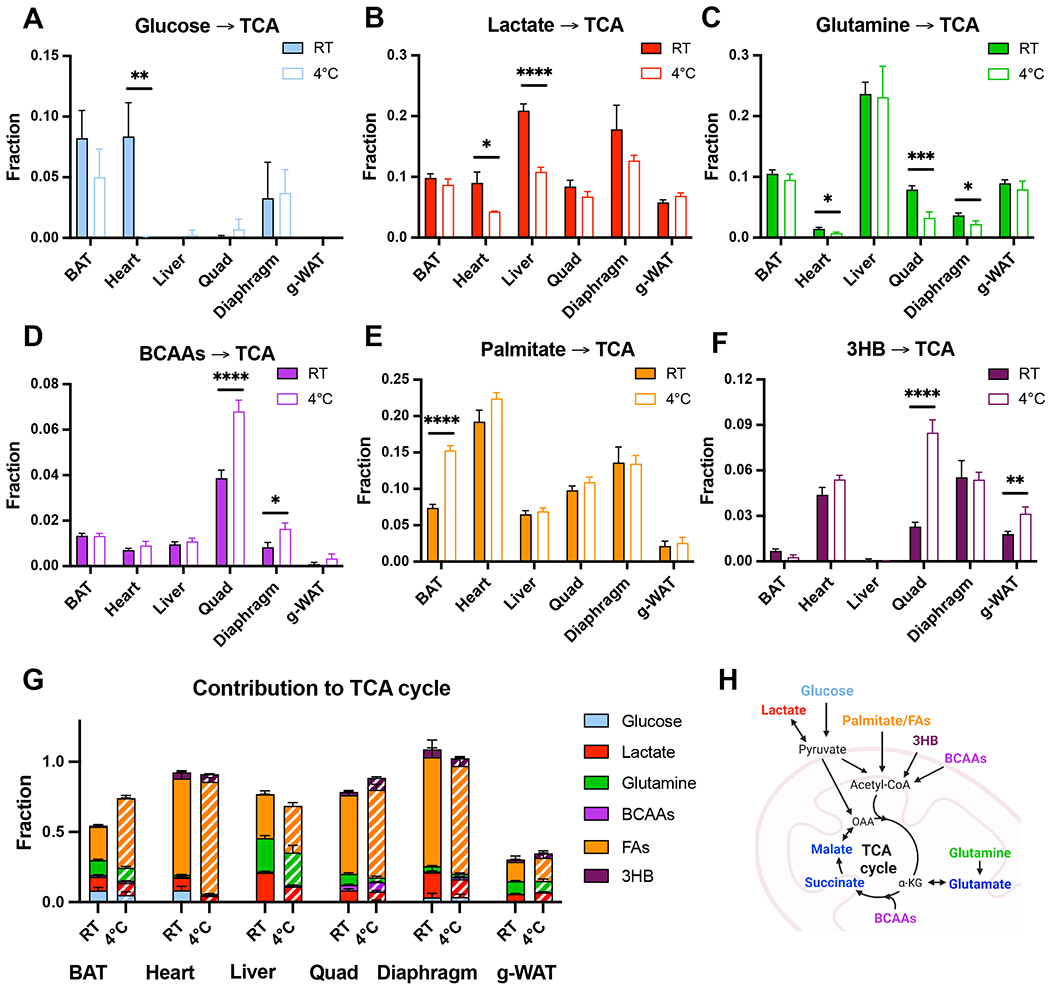
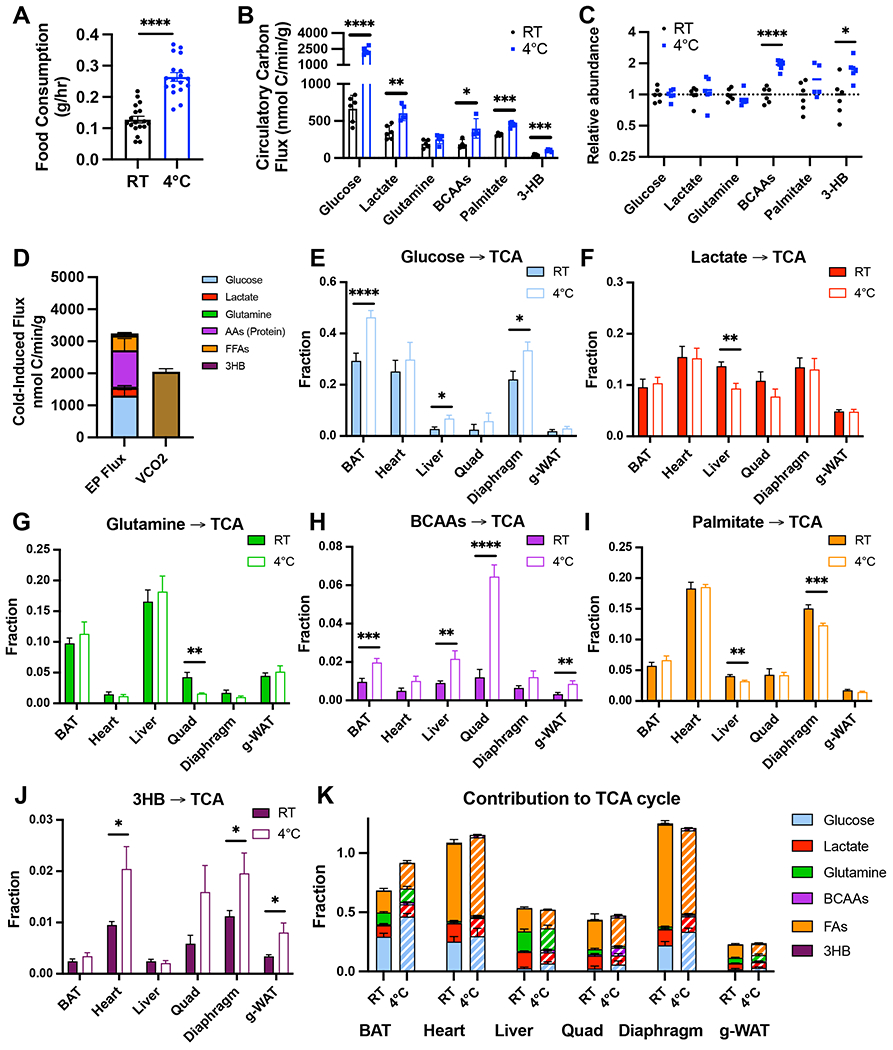
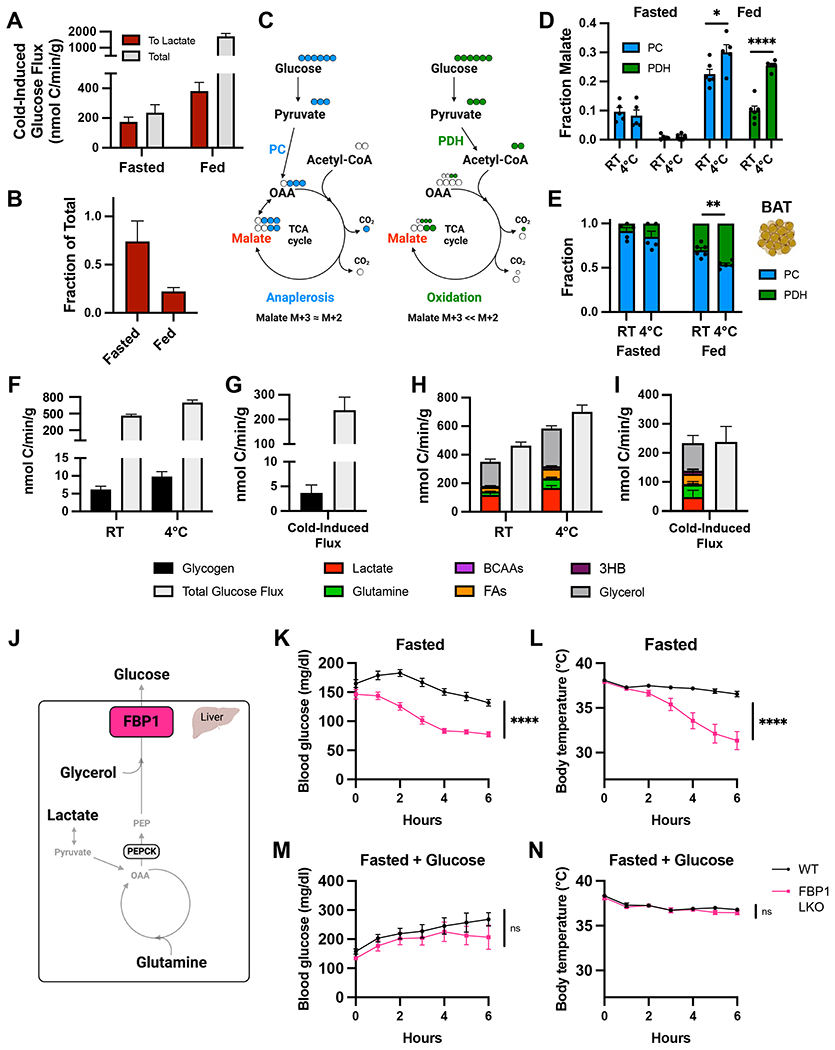
Cold-induced thermogenesis (CIT) is widely studied as a potential avenue to treat obesity, but a thorough understanding of the metabolic changes driving CIT is lacking. Here, we present a comprehensive and quantitative analysis of the metabolic response to acute cold exposure, leveraging metabolomic profiling and minimally perturbative isotope tracing studies in unanesthetized mice. During cold exposure, brown adipose tissue (BAT) primarily fueled the tricarboxylic acid (TCA) cycle with fat in fasted mice and glucose in fed mice, underscoring BAT's metabolic flexibility. BAT minimally used branched-chain amino acids or ketones, which were instead avidly consumed by muscle during cold exposure. Surprisingly, isotopic labeling analyses revealed that BAT uses glucose largely for TCA anaplerosis via pyruvate carboxylation. Finally, we find that cold-induced hepatic gluconeogenesis is critical for CIT during fasting, demonstrating a key functional role for glucose metabolism. Together, these findings provide a detailed map of the metabolic rewiring driving acute CIT.

Keywords: FBP1; brown adipose tissue; cold exposure; flux; gluconeogenesis; glucose; metabolomics; pyruvate carboxylase; thermogenesis.


Conflict of interest statement

Declaration of interests The authors declare no competing interests.

Figures

Figure 1:
Figure 1:. Cold exposure induces broad and systemic metabolic changes.
Arterial plasma metabolite concentrations from male, 14-15 week-old mice housed without food for 6 hours at room temperature (RT, n=20) or 4°C (n=21). (A) Heatmap of differentially abundant metabolites. (B) Volcano plot comparing plasma metabolite levels in mice at 4°C or RT. (C-E) Log2 fold change of individual (C) free fatty acids, (D) triglycerides, and (E) monoacylglycerols in plasma from mice at 4°C vs. RT. (F) Percent change in individual amino acids in plasma from mice at 4°C compared to RT. Error bars represent standard error.
Figure 2:
Figure 2:. Metabolic rewiring across organs in response to cold stress.
Tissue metabolite concentrations from male, 14-15 week-old mice housed without food for 6 hours at RT or 4°C (n=6). (A-F) Volcano plots comparing metabolite levels in (A) BAT, (B) Heart, (C) Liver, (D) Quadriceps muscle (Quad), (E) Diaphragm, and (F) gonadal WAT (g-WAT) from mice at 4°C vs. RT. (G) Fold-changes and FDR-adjusted p-values of broadly-detected detected metabolites in each organ.
Figure 3:
Figure 3:. Quantifying cold-induced changes in whole-body carbon flux in fasted mice.
(A) Model demonstrating 13C-metabolite infusion system. (B) Circulatory carbon flux (n=4-6), and (C) metabolite abundance in arterial plasma (n=20-21) for key metabolites in mice at room temperature (RT) or acutely exposed to 4°C without access to food. (D) Select absolute flux rates between circulating nutrients in nmol carbon/min/g. (E) End-product flux rates of key metabolites in mice at RT or 4°C. (F) Cold-induced increase in end-product flux rates and VCO2. Error bars represent standard error. *p<0.05, **p<0.01, ***p<0.001, ****p<0.0001 by two-tailed t-test.
Figure 4:
Figure 4:. Quantifying organ-specific fuel preference during acute cold exposure in fasted mice.
(A-G) Direct contributions of (A) Glucose, (B) Lactate, (C) Glutamine, (D) BCAAs, (E) Palmitate, (F) 3-hydroxybutyrate, and (G) all nutrients combined, including an estimation of total FAs, to the TCA cycle (malate, succinate, and glutamate) in different organs in mice at RT or acutely exposed to 4°C for 6 hours without food. (H) Diagram of nutrient contribution to the TCA cycle. Error bars represent standard error. *p<0.05, **p<0.01, ***p<0.001, ****p<0.0001 by two-tailed t-test.
Figure 5:
Figure 5:. Quantifying substrate use during acute cold stress in ad libitum fed mice.
(A) Food consumption by ad libitum fed mice housed at room temperature (RT) or acutely exposed to 4°C for 6 hours. (B) Circulatory carbon flux (n=4-6), and (C) metabolite abundance in arterial plasma (n=5-6) for key metabolites in fed mice at RT or acutely exposed to 4°C. (D) Cold-induced increase in end-product flux rates and VCO2 during ad lib feeding. (E-K) Direct contributions of (E) Glucose, (F) Lactate, (G) Glutamine, (H) BCAAs, (I) Palmitate, (J) 3-hydroxybutyrate, and (K) all nutrients combined, including an estimation of total FAs, to the TCA cycle (malate, succinate, and glutamate) in different organs in ad lib fed mice at RT or acutely exposed to 4°C for 6 hours. Error bars represent standard error. *p<0.05, **p<0.01, ***p<0.001, ****p<0.0001 by two-tailed t-test.
Figure 6:
Figure 6:. Liver gluconeogenesis fuels anaplerosis in BAT and is required for cold tolerance.
(A) Cold induced increase in flux from glucose to lactate and total glucose flux in fasted or ad libitum fed mice. (B) Fraction of total cold-induced increase in glucose flux that can be accounted for by generation of lactate. (C) Schematic showing carbon tracing from glucose to malate via either pyruvate carboxylation (PC) or oxidation by pyruvate dehydrogenase (PDH). (D) Fraction of malate derived from glucose via either PC or PDH flux in BAT of fasted and ad libitum fed mice at room temperature (RT) or 4°C (n=5-6). (E) Fraction of total glucose flux to malate via PC vs. PDH pathways in BAT (n=5-6). (F) Flux of glucose attributable to the net decrease in glycogen from 3 to 6 hours compared total glucose flux in fasting mice at RT or 4°C. (G) Cold-induced increase in glucose flux from glycogen and total glucose flux. (H) Flux from various nutrients to glucose compared to total glucose flux from fasting mice housed at RT or 4°C. (I) Cold-induced increase in flux from various nutrients to glucose and total glucose flux. (J) Schematic showing FBP1-mediated gluconeogenesis in liver. (K) Blood glucose levels (n=9-11) and (L) body temperatures (n=12-15) of FBP1 Liver-knockout (FBP1 LKO) and control (WT) mice acutely exposed to 4°C without food. (K) Blood glucose levels (n=7-8) and (L) body temperatures (n=7-8) of FBP1 LKO and WT mice acutely exposed to 4°C without food but with 15% glucose provided in drinking water. Error bars represent standard error. *p<0.05, **p<0.01, ***p<0.001, ****p<0.0001 by two-tailed t-test.

Similar articles

Cited by

References

    1. Oelkrug R, Polymeropoulos ET, and Jastroch M (2015). Brown adipose tissue: physiological function and evolutionary significance. J. Comp. Physiol. B Biochem. Syst. Environ. Physiol 185, 587–606. 10.1007/s00360-015-0907-7. - DOI - PubMed
    1. Hayes JP, and Garland Jnr T (1995). The evolution of endothermy: Testing the aerobic capacity model. Evolution (N. Y) 49, 836–847. 10.1111/j.1558-5646.1995.tb02320.x. - DOI - PubMed
    1. Nakamura K, and Morrison SF (2008). A thermosensory pathway that controls body temperature. Nat. Neurosci 11, 62–71. 10.1038/nn2027. - DOI - PMC - PubMed
    1. Commission IT (2003). Glossary of terms for thermal physiology. J. Therm. Biol 28, 75–106. 10.1152/jappl.1973.35.6.941. - DOI
    1. Yoneshiro T, Aita S, Matsushita M, Kayahara T, Kameya T, Kawai Y, Iwanaga T, and Saito M (2013). Recruited brown adipose tissue as an antiobesity agent in humans. J. Clin. Invest 123, 3404–3408. 10.1172/JCI67803. - DOI - PMC - PubMed

Publication types

LinkOut - more resources