. 2023 Oct;10(2):e000976.
doi: 10.1136/lupus-2023-000976.

High-dimensional analysis of T-cell profiling variations following belimumab treatment in systemic lupus erythematosus

Affiliations

High-dimensional analysis of T-cell profiling variations following belimumab treatment in systemic lupus erythematosus

Shinji Maeda et al. Lupus Sci Med. 2023 Oct.

Abstract

Objective: This study sought to elucidate the molecular impacts of belimumab (BEL) treatment on T-cell immune profiling in SLE.

Methods: We used mass cytometry with 25 marker panels for T-cell immune profiling in peripheral blood T cells (CD3+) from 22 patients with BEL-treated SLE and 20 controls with non-BEL-treated SLE. An unsupervised machine-learning clustering, FlowSOM, was used to identify 39 T-cell clusters (TCLs; TCL01-TCL39). TCLs (% of CD3+) showing significant (p<0.05) associations with BEL treatment (BEL-TCL) were selected by a linear mixed-effects model for comparing groups of time-series data. Furthermore, we analysed the association between BEL treatment and variations in regulatory T-cell (Treg) phenotypes, and the ratio of other T-cell subsets to Treg as secondary analysis.

Results: Clinical outcomes: BEL treatment was associated with a decrease in daily prednisolone use (coef=-0.1769, p=0.00074), and an increase in serum CH50 (coef=0.4653, p=0.003), C3 (coef=1.1047, p=0.00001) and C4 (coef=0.2990, p=0.00157) levels. Molecular effects: five distinct BEL-TCLs (TCL 04, 07, 11, 12 and 27) were identified. Among these, BEL-treated patients exhibited increased proportions in the Treg-like cluster TCL11 (coef=0.404, p=0.037) and two naïve TCLs (TCL04 and TCL07). TCL27 showed increased levels (coef=0.222, p=0.037) inversely correlating with baseline C3 levels. Secondary analyses revealed associations between BEL treatment and an increase in Tregs (coef=1.749, p=0.0044), elevated proportions of the fraction of Tregs with inhibitory function (fTregs, coef=0.7294, p=0.0178) and changes in peripheral helper T cells/fTreg (coef=-4.475, p=0.0319) and T helper 17/fTreg ratios (coef=-6.7868, p=0.0327). Additionally, BEL was linked to variations in T-cell immunoglobulin and mucin domain-containing protein-3 expression (coef=0.2422, p=0.039).

Conclusions: The study suggests an association between BEL treatment and variations in T cells, particularly Tregs, in SLE pathologies involving various immune cells.

Keywords: T-lymphocytes, helper-inducer; autoimmunity; lupus erythematosus, systemic.


Conflict of interest statement

Competing interests: AN reports personal fees from GlaxoSmithKline outside the submitted work. All authors declare that they have no known competing financial interests or personal relationships that could have potentially swayed the research presented in this paper.

Figures

Figure 1
Figure 1
Changes in the clinical parameters by belimumab treatment. The figure illustrates changes in SLE-Disease Activity Index-2000 (SLEDAI-2K), oral steroid dose (prednisolone equivalent daily dose), antidouble-stranded DNA IgG antibody (assessed by ELISA), anti-DNA antibody (assessed by radioimmunoassay) and complement titres (CH50, C3 and C4) in both belimumab group (BEL-G) and control group (CON-G) using box-and-whisker plots. Comparisons were made between the two groups, with p values calculated using a linear mixed-effects model. A p value <0.05 was considered significant and is denoted by an asterisk.
Figure 2
Figure 2
Immunophenotypic features of T-cell clusters (TCLs) CD3+ T-cell data from all 42 concatenated samples were clustered using the FlowSOM algorithm, which analyses high-dimensional cytometric data using self-organising maps, and 39 TCLs (cluster numbers 0–39) were identified. The expression of 25 surface markers for each TCL is shown in the heatmap. On the right, the percentage of each TCL (% of CD3+) is shown as a grey bar graph.
Figure 3
Figure 3
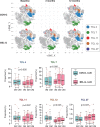
Belimumab (BEL) treatment-induced changes in T-cell clusters (TCLs). The five TCLs (TCL4, TCL7, TCL11, TCL12 and TCL2) that differed significantly between BEL group (BEL-G) and control group (CON-G) are shown in the t-distributed stochastic neighbour embedding (t-SNE) map by group and time (top panel). Whole CD3+ T cells are indicated by the grey dots. Changes in the proportions of the five TCLs (% of CD3+ T cells) are shown in a box-and-whisker plot (bottom graph). P values were calculated using a linear mixed-effects model.
Figure 4
Figure 4
Helper T-cell changes induced by belimumab (BEL). The change in the percentage of each helper T-cell (% of CD4+ T cells) is shown using box-and-whisker plots. Both groups were compared, and p values were calculated using a linear mixed-effects model. P<0.05 was considered significant and indicated by an asterisk. BEL-G, BEL group; CON-G, control group.
Figure 5
Figure 5
Effects of belimumab (BEL) on regulatory T cells (Tregs). Changes in Treg subsets (Treg Fr I, II, III, fTreg and activated Treg), Th/Treg balance (Th1/fTreg, Th2/fTreg, Th17/fTreg, Th17.1/fTreg, Tfh/fTreg and Tph/fTreg) and Treg cell surface molecule levels (CTLA-4, PD-1, 4-1BB, CD28, LAG-3, ICOS, OX-40, Fas, TIM-3 and HLA-DR) by BEL treatment were analysed using a linear mixed-effects model. Representative results are shown in the box-and-whisker plot. P<0.05 was considered significant and indicated by an asterisk. BEL-G, BEL group; CON-G, control group; CTLA-4, cytotoxic T-lymphocyte-associated antigen-4; HLA-DR, human leucocyte antigen-DR isotype; ICOS, inducible T-cell costimulator; LAG-3, lymphocyte-activation gene 3; PD-1, programmed death-1; TIM-3, T-cell immunoglobulin and mucin domain containing protein-3.

Similar articles

Cited by

References

    1. Doria A, Gatto M, Zen M, et al. . Optimizing outcome in SLE: treating-to-target and definition of treatment goals. Autoimmunity Reviews 2014;13:770–7. 10.1016/j.autrev.2014.01.055 - DOI - PubMed
    1. Sutton EJ, Davidson JE, Bruce IN. The systemic lupus International collaborating clinics (SLICC) damage index: A systematic literature review. Seminars in Arthritis and Rheumatism 2013;43:352–61. 10.1016/j.semarthrit.2013.05.003 - DOI - PubMed
    1. Gatto M, Zen M, Iaccarino L, et al. . New therapeutic strategies in systemic lupus erythematosus management. Nat Rev Rheumatol 2019;15:30–48. 10.1038/s41584-018-0133-2 - DOI - PubMed
    1. Vilas-Boas A, Morais SA, Isenberg DA. Belimumab in systemic lupus erythematosus. RMD Open 2015;1:e000011. 10.1136/rmdopen-2014-000011 - DOI - PMC - PubMed
    1. Vashisht P, Borghoff K, O’Dell JR, et al. . Belimumab for the treatment of recalcitrant cutaneous lupus. Lupus 2017;26:857–64. 10.1177/0961203316682097 - DOI - PubMed

Publication types

MeSH terms

Substances