. 2023 Oct 6;14(1):6257.
doi: 10.1038/s41467-023-41594-y.

Injectable and biodegradable piezoelectric hydrogel for osteoarthritis treatment

Affiliations

Injectable and biodegradable piezoelectric hydrogel for osteoarthritis treatment

Tra Vinikoor et al. Nat Commun. .

Abstract

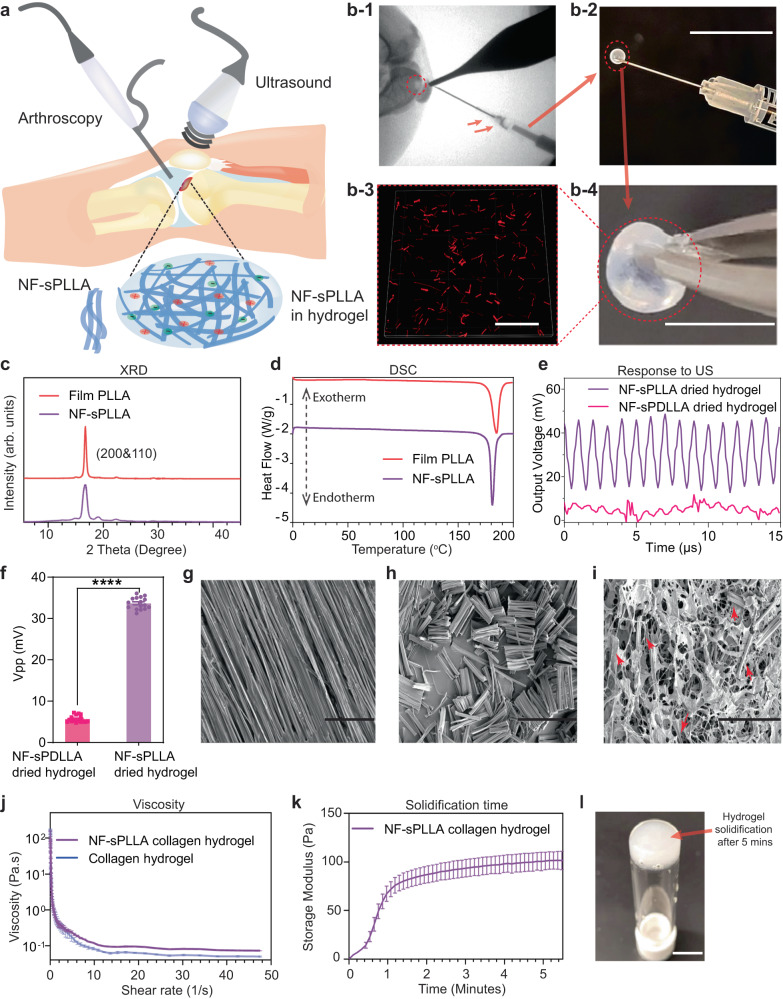
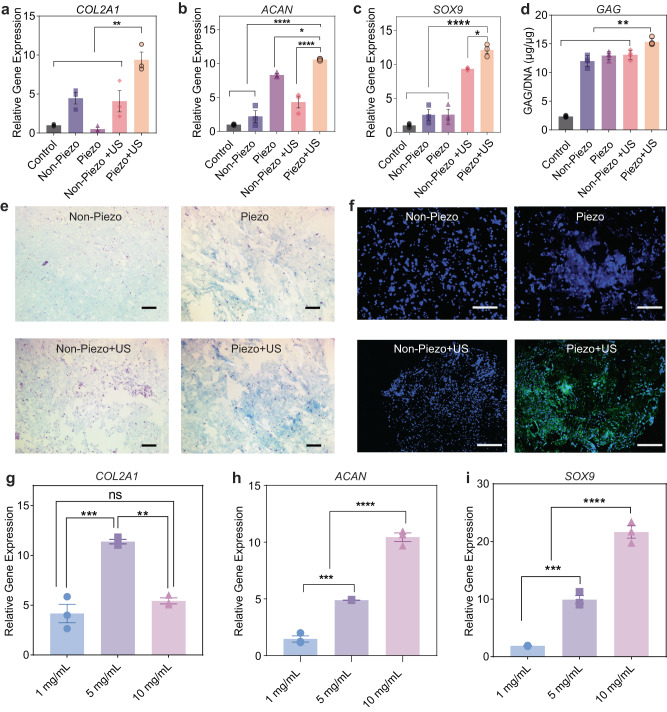
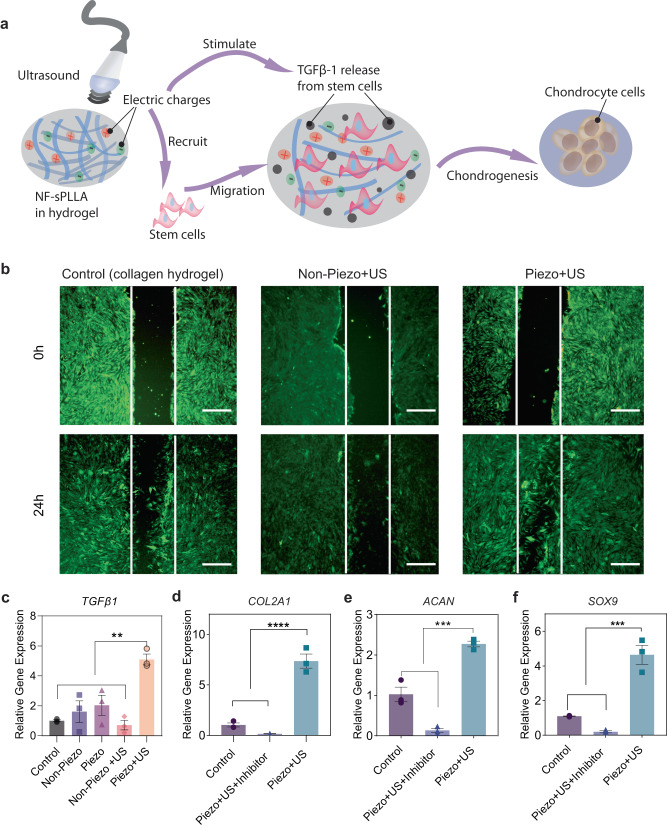
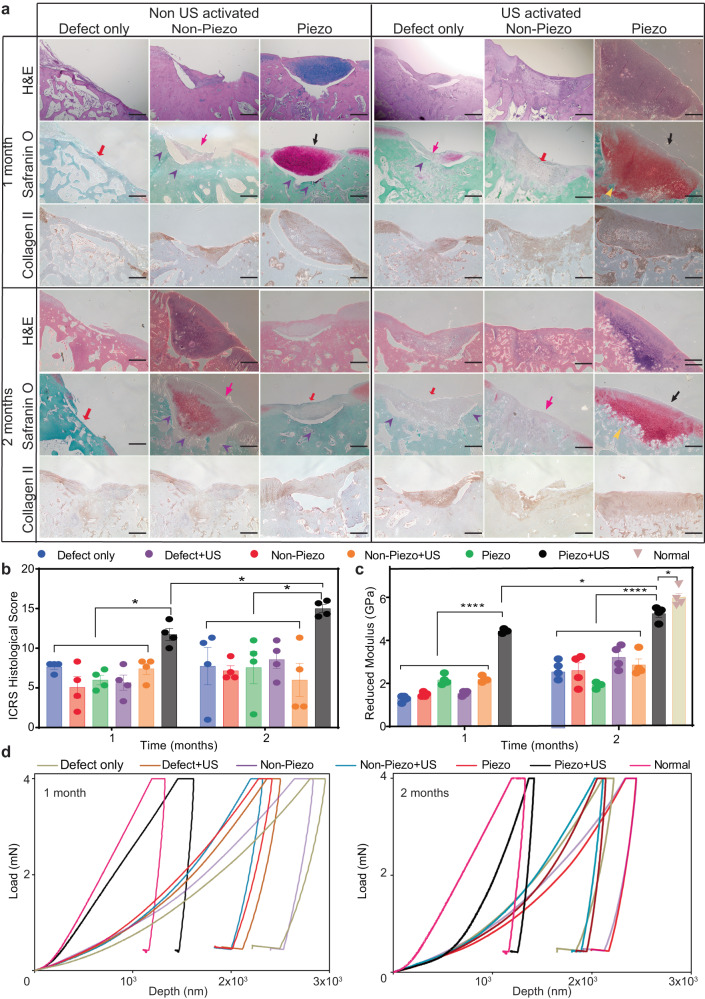
Osteoarthritis affects millions of people worldwide but current treatments using analgesics or anti-inflammatory drugs only alleviate symptoms of this disease. Here, we present an injectable, biodegradable piezoelectric hydrogel, made of short electrospun poly-L-lactic acid nanofibers embedded inside a collagen matrix, which can be injected into the joints and self-produce localized electrical cues under ultrasound activation to drive cartilage healing. In vitro, data shows that the piezoelectric hydrogel with ultrasound can enhance cell migration and induce stem cells to secrete TGF-β1, which promotes chondrogenesis. In vivo, the rabbits with osteochondral critical-size defects receiving the ultrasound-activated piezoelectric hydrogel show increased subchondral bone formation, improved hyaline-cartilage structure, and good mechanical properties, close to healthy native cartilage. This piezoelectric hydrogel is not only useful for cartilage healing but also potentially applicable to other tissue regeneration, offering a significant impact on the field of regenerative tissue engineering.


Conflict of interest statement

T.D.N. has a conflict of interest with PiezoBioMembrane Inc. and SingleTimeMicroneedles Inc. Eli Curry is currently an employee and common stock owner of Eli Lilly and Company. The work presented herein was completed prior to his employment with Eli Lilly and Company. Eli Curry is acting entirely on his own and any opinions or endeavors expressed herein are not in any manner affiliated with Eli Lilly and Company. T.V and T.D.N are inventors of the patent application PCT/US2021/053887. The remaining authors declare no competing interests.

Figures

Fig. 1
Fig. 1. Characterization of injectable piezoelectric hydrogel.
a Schematic illustration of the use of piezoelectric hydrogel for OA patients. The piezoelectric hydrogel contains piezoelectric short nanofibers of PLLA (NF-sPLLA) and a hydrogel matrix of collagen, which could be injected into knee joints by arthroscopy or X-ray guidance. The piezoelectric hydrogel is activated by an external US device to generate electrical cues. b-1 Visualization of a knee defect (red dash circle) on a rabbit cadaver under X-ray and the delivery of our injectable piezoelectric hydrogel. b-2 Loading piezoelectric hydrogel using insulin G29 needle to test injectability (Scale bar: 1 cm). b-3 Fluorescent image of rhodamine B stained NF-sPLLA (red) to visualize the distribution of the short nanofibers inside collagen I matrix (Scale bar: 100 µm). b-4 Macroscopic image of solidified piezoelectric hydrogel (Scale bar: 1 cm). c One-dimensional XRD of nanofiber film of PLLA (named as Film PLLA) before sectioning and NF-sPLLA after sectioning (arb. units = arbitrary units). d DSC results of PLLA nanofiber film and NF-sPLLA. e Output voltage waveform of sensors made of our dried NF-sPLLA hydrogel scaffold (Piezo sample) and NF-sPDLLA hydrogel (Non-piezo sample) in collagen under US activation (n = 4 for independent sensors). f Peak-to-Peak output voltage of sensors made of our dried scaffold NF-sPLLA (Piezo sample) and NF-sPDLLA (Non-piezo sample) in collagen under US activation (n = 4 for independent sensors, each sensor is measured one time with 4 data points collected, ****p < 0.000001, T test, Two-tailed, the data are expressed as Mean ± SEM value). g SEM image of film PLLA before sectioning (Scale bar: 40 µm). h SEM image of NF-sPLLA after sectioning (Scale bar: 40 µm). i SEM image of NF-sPLLA (red arrows) in dried collagen scaffold (Scale bar: 40 µm). j Viscosity measurement of NF-sPLLA in collagen hydrogel and collagen hydrogel only (n = 3 independent samples, the data are expressed as Mean ± SD value). k Time sweep testing to determine the gelation time of NF-sPLLA collagen hydrogel at 37 °C (n = 3 independent samples, the data are expressed as Mean ± SEM value). l Photograph of upside-down vial of the solidified piezoelectric NF-sPLLA hydrogel that formed a stable structure at 37 °C after 5 mins (the experiment was repeated four times with similar results). Exact p value were provided in the Source Data file.
Fig. 2
Fig. 2. Piezoelectric hydrogel for chondrogenesis in vitro study.
ac Relative gene expression of the chondrogenic gene markers COL2A1, ACAN, and SOX9 (n = 3 independent samples, the data are expressed as Mean ± SEM value. *p < 0.05, **p < 0.01 and ****p < 0.0001, one-way ANOVA, Dunnett’s multiple comparisons test). d GAG/DNA (µg/ µg) ratio carried out by dimethyl methylene blue (DMMB) kit and dsDNA qualification kit, (n = 4 independent samples, the data are expressed as Mean ± SEM value **p < 0.01, one-way ANOVA, Dunnett’s multiple comparisons test). e Alcian blue staining of GAGs (blue) and nuclei (pink) after 2 weeks of culturing cells on different hydrogels (Scale bars: 200 μm). f Type II collagen visualization with Immunofluorescence (green) and nuclei (blue) on different hydrogel (Scale bars: 200 μm). gi Relative gene expression of the chondrogenic gene markers COL2A1, ACAN, and SOX9 respectively of ADSCs in the piezoelectric hydrogels with different concentrations of NF-sPLLA and activated by US (n = 3 independent samples, the data are expressed as mean ± SEM value, **p < 0.01, ***p < 0.001 and ****p < 0.0001, one-way ANOVA, Tukey’s multiple comparison tests). Exact p value were provided in the Source Data file.
Fig. 3
Fig. 3. Activated piezoelectricity induces chondrogenesis by recruiting the stem cells and stimulating the cells to secrete endogenous TGF-β1.
a Illustration of the hypothesis in which the piezoelectric hydrogel along with US activation recruits host cells and also induces the cells to release endogenous growth factors TGF-β1 which enhance cartilage healing. b Stem cell migration study evaluated by scratch test which was done by filling the wound bed with Piezo, Non-Piezo, and collagen hydrogel (Scale bars: 500 μm). c Relative gene TGF-β1 expression after 2 days of culturing stem cells inside different hydrogels and stimulation conditions (n = 3 independent samples, the data are expressed as Mean ± SEM value, **p < 0.01, one-way ANOVA, Dunnett’s multiple comparisons test). df Relative gene expression of the chondrogenic gene markers COL2A1, ACAN, and SOX9 respectively from stem cells inside our US-activated piezoelectric hydrogel with and without TGF-β inhibitors (n = 3 independent samples, the data are expressed as mean ± SEM value ***p < 0.001, one-way ANOVA, Dunnett’s multiple comparisons test). Exact p values were provided in the Source Data file.
Fig. 4
Fig. 4. Piezoelectric hydrogel enhances cartilage healing evaluated by macroscopic scoring, and subchondral bone formation in vivo.
a The digital photographs showing the rabbit femurs with defect only, non-piezo, and piezo hydrogel group with or without US activation (1–2 months). The red circle marks where the defect was originally created. b Reconstruction of the bone on femurs using µ-CT. c ICRS score for macroscopic cartilage evaluation for 1- and 2-months US activation on rabbit knees (n = 4 knees for each group, the score was an average point from three independent professionals and blinded evaluation, the data are expressed as data points with Mean ± SEM, *p < 0.05, one-way ANOVA, Two-stage linear step-up procedure of Benjamini, Krieger and Yekutieli were use for the sample in the same time point. t test, two-tailed was used to compare Piezo + US (1 month) vs Piezo + US (2 months)). d Volume of subchondral bone formed inside defect after 1 or 2 months of US treatment (n = 4 knees for each group, the data are expressed as points with Mean ± SEM. *p < 0.05, n.s = not significant, one-way ANOVA, Dunnett’s multiple comparisons test). Exact p value were provided in the Source Data file.
Fig. 5
Fig. 5. Piezoelectric hydrogel induces cartilage healing, evaluated by histology assessment and mechanical testing in vivo.
a H&E staining and Safranin O/fast green and collagen II staining to evaluate the articular cartilage regeneration for sham (defect only), non-piezo/piezo PLLA hydrogels with and without US activation (1–2 months). Black arrows indicate newly formed cartilage tissues. Yellow markers indicate the new cartilage tissue which was well-integrated with the native host tissue. Hot pink arrows indicate fibrillation filling, red arrows indicate bony tissue and violet markers indicate the detachment of newly formed tissue from the host (n = 4 knees for each group, scale bars: 500 μm). b ICRS histological evaluation, (n = 4 knees for each group, the score was an average point from three independent professionals and a blinded evaluation, the data are expressed as data points with Mean ± SEM *p < 0.05, one-way ANOVA, Dunnett’s multiple comparisons test were used for the sample in the same time point. t-test, two-tailed was used to compare Piezo + US (1 month) vs Piezo + US (2 months)). c Reduced modulus of newly formed cartilage inside the defect of different hydrogel groups with and without 1–2 month US activation. Normal healthy rabbit cartilage serves as a positive control (n = 4 knees for each group, random indentation-testing position, the data are expressed as boxes with points and means ± SEM. ****p < 0.0001, *p < 0.05, one-way ANOVA Dunnett’s multiple comparisons test were used for the sample in the same time point. t-test, two-tailed was used to compare Piezo + US (1 month) vs Piezo + US (2 months)). d Representative indentation curves for different groups indicate 1 month of treatment (left) and 2 months of treatment (right). Exact p value were provided in the Source Data file.

References

    1. Cui A, et al. Global, regional prevalence, incidence and risk factors of knee osteoarthritis in population-based studies. EClinicalMedicine. 2020;29–30:100587. doi: 10.1016/j.eclinm.2020.100587. - DOI - PMC - PubMed
    1. Lin J, Zhang W, Jones A, Doherty M. Efficacy of topical non-steroidal anti-inflammatory drugs in the treatment of osteoarthritis: meta-analysis of randomised controlled trials. BMJ. 2004;329:324. doi: 10.1136/bmj.38159.639028.7C. - DOI - PMC - PubMed
    1. da Costa BR, et al. Effectiveness and safety of non-steroidal anti-inflammatory drugs and opioid treatment for knee and hip osteoarthritis: network meta-analysis. BMJ. 2021;375:n2321. doi: 10.1136/bmj.n2321. - DOI - PMC - PubMed
    1. Krüger T, Wohlrab D, Birke A, Hein W. Results of arthroscopic joint debridement in different stages of chondromalacia of the knee joint. Arch. Orthop. Trauma Surg. 2000;120:338–342. doi: 10.1007/s004020050478. - DOI - PubMed
    1. Ozmeriç A, Alemdaroğlu KB, Aydoğan NH. Treatment for cartilage injuries of the knee with a new treatment algorithm. World J. Orthop. 2014;5:677–684. doi: 10.5312/wjo.v5.i5.677. - DOI - PMC - PubMed

Publication types