. 2023 Oct 6;14(1):6234.
doi: 10.1038/s41467-023-41454-9.

A pharmacophore-guided deep learning approach for bioactive molecular generation

Affiliations

A pharmacophore-guided deep learning approach for bioactive molecular generation

Huimin Zhu et al. Nat Commun. .

Abstract

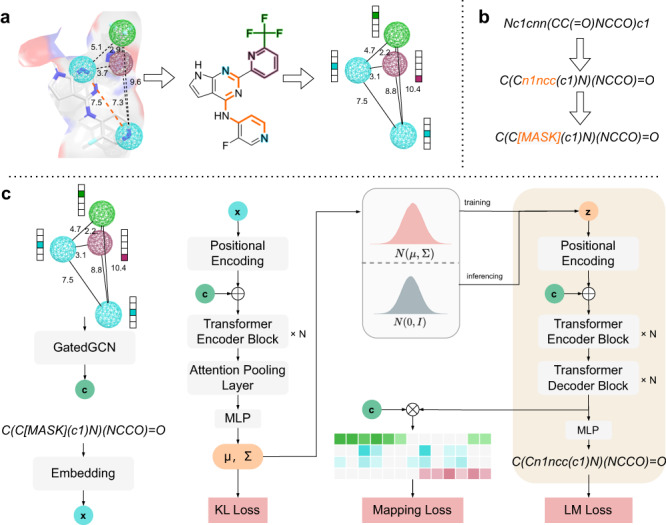
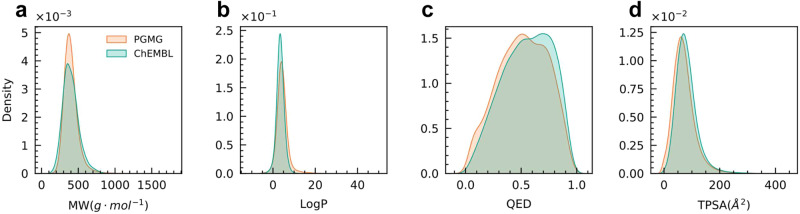
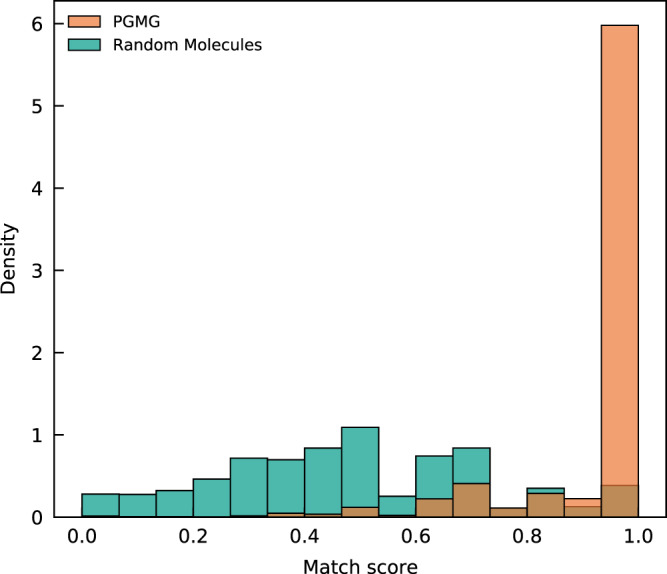
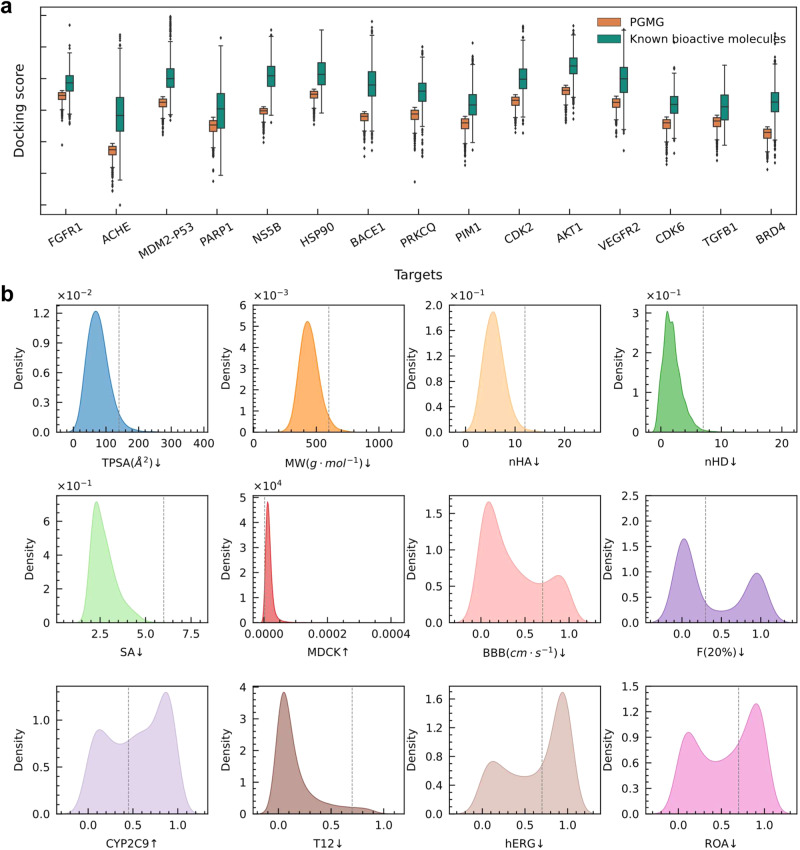
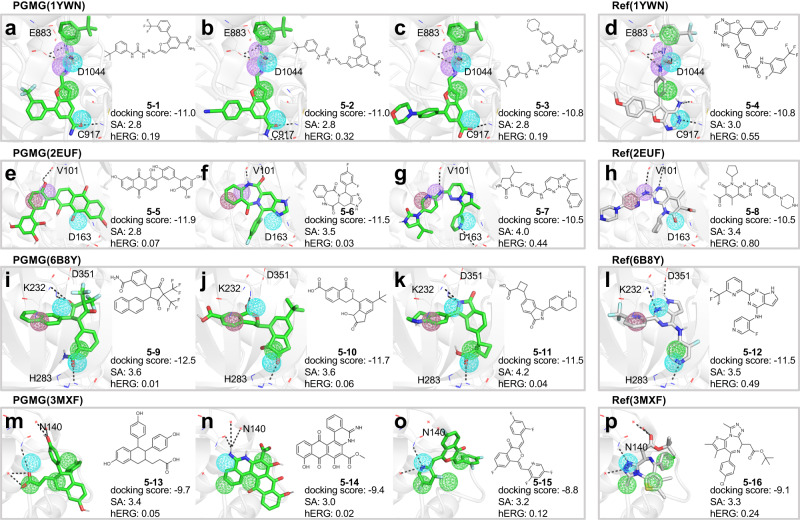
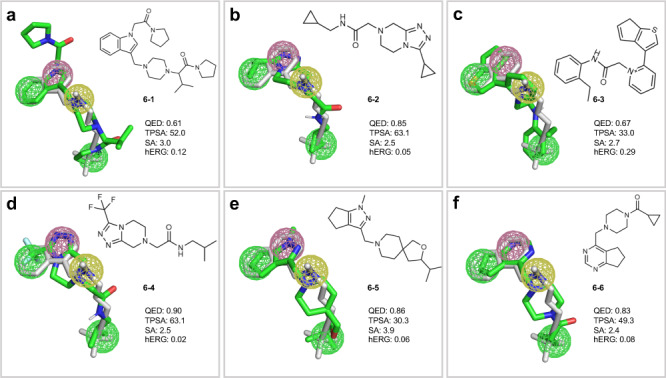
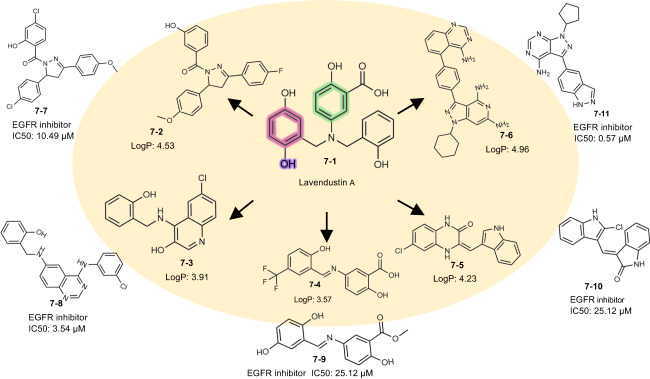
The rational design of novel molecules with the desired bioactivity is a critical but challenging task in drug discovery, especially when treating a novel target family or understudied targets. We propose a Pharmacophore-Guided deep learning approach for bioactive Molecule Generation (PGMG). Through the guidance of pharmacophore, PGMG provides a flexible strategy for generating bioactive molecules. PGMG uses a graph neural network to encode spatially distributed chemical features and a transformer decoder to generate molecules. A latent variable is introduced to solve the many-to-many mapping between pharmacophores and molecules to improve the diversity of the generated molecules. Compared to existing methods, PGMG generates molecules with strong docking affinities and high scores of validity, uniqueness, and novelty. In the case studies, we use PGMG in a ligand-based and structure-based drug de novo design. Overall, the flexibility and effectiveness make PGMG a useful tool to accelerate the drug discovery process.


Conflict of interest statement

The authors declare no competing interests.

Figures

Fig. 1
Fig. 1. The overall architecture of PGMG.
a Construction of the pharmacophore networks. We use the shortest paths on the molecular graph to determine the distances between two pharmacophore features, based on which a fully connected graph was constructed to represent a pharmacophore hypothesis. Different colours represent different types of pharmacophore features. b Preprocessing of SMILES. We randomise a given canonical SMILES and corrupt it using the infilling scheme. c Pipelines for model training and inference. c represents the embedding vector sequences for the given pharmacophore hypothesis; x represents the embedding sequence of the input SMILES; and z represents the latent variables for a molecule. During inference, z is drawn from a predefined normal distribution N(0,I) while during training, it is sampled from a learned distribution N(μ,Σ). The transformer encoder and decoder blocks are stacked with N layers. denotes the concatenation of two vectors and matrix multiplication. The overlap between the training and inferencing processes is highlighted in the right panel. GatedGCN stands for Gated Graph Convolutional Network, and MLP stands for Multi-Layer Perceptron.
Fig. 2
Fig. 2. Distribution of the physicochemical properties for the ChEMBL training set and molecules generated by PGMG.
a Molecule weight (MW); (b) the Wildman–Crippen partition coefficient (LogP); (c) quantitative estimate of drug-likeness (QED); (d) topological polar surface area (TPSA). The PGMG generated molecules include a total of 100,000 molecules from random pharmacophore hypotheses and the ChEMBL molecules comprise 100,000 molecules randomly sampled from the ChEMBL training datasets.
Fig. 3
Fig. 3. The distributions of the match scores of PGMG-generated molecules compared with randomly selected molecules.
A total of approximately 236,000 molecules were generated using PGMG from random pharmacophore hypotheses extracted from the test dataset and the match scores are calculated and compared with the results of molecules randomly sampled from the training dataset.
Fig. 4
Fig. 4. Docking scores and properties distribution of PGMG-generated molecules.
a The distributions of the docking scores of the top 1,000 molecules generated by PGMG over 15 targets compared with those of the top 1000 known bioactive molecules (using a threshold of pChEMBL >4). The pChEMBL value is the negative logarithm of the molar IC50, EC50, Ki, Kd, or Potency, and it allows these roughly comparable measures to be compared. The median is represented by the centerline of the boxplot, while the first and third quartiles are indicated by the bounds of the box. The whiskers represent the 1.5 interquartile range (IQR). b Distributions of the ADMET properties of the top 1000 molecules generated by PGMG. The dashed lines represent the thresholds of these properties, for which an upward arrow indicates that values higher than the threshold are preferred, while a downward arrow indicates that values lower than the threshold are preferred. TPSA represents the topological polar surface area, suitable when: 0–140 (Å2); MW denotes the molecular weight, suitable when: 100–600; nHA represents the number of hydrogen bond acceptors, suitable when: 0–12; nHD represents the number of hydrogen bond donors, suitable when: 0–7; SA is the synthetic accessibility score, suitable when: <6; the predicted Madin–Darby Canine Kidney cells (MDCK) measures the uptake efficiency of a drug into the body, suitable when: >2 × 10⁻⁶ (cm/s); BBB is the predicted probability of a drug to cross the blood-brain barrier to its molecular targets, qualified value: 0–0.7; F(20%) is the predicted probability of molecules with a human oral bioavailability <20%, suitable when: <0.3; CYP2C9 assesses drug metabolism reactions, and the value is the predicted probability of being an inhibitor; T12 assesses the half-life of the drug, and the value of T12 is the predicted probability of the half-life ≤3; hERG evaluates whether the molecule is toxic to the heart, and the value of hERG is the predicted probability of being inhibiting to the human ether-a-go-go gene; ROA measures acute toxicity in mammals. The value of ROA is the predicted probability of being toxic.
Fig. 5
Fig. 5. Binding sites of PGMG-generated molecules in a structure-based drug design.
The molecular structure, docking scores, synthetic accessibilities (SA), the predicted probabilities of hERG inhibition (hERG) of the top-ranking molecules and the reference active molecule are given for each target with the corresponding pharmacophore hypothesis: (ad) VEGFR2 (PDBID: 1YWN), (eh) CDK6 (PDBID: 2EUF); (il) TGFB1 (PDBID: 6B8Y); and (mp) BRD4 (PDBID: 3MXF). Different pharmacophore features are shown in different colours: magenta red (aromatic ring), green (hydrophobic group), purple (hydrogen bond donor), blue (hydrogen bond acceptor). The conformations of generated molecules are acquired through docking.
Fig. 6
Fig. 6. Alignment of terbinafine (grey) and molecules (green) generated by PGMG.
af Represent the alignment of six structurally different molecules generated by PGMG with the conformation of terbinafine. The coloured spheres represent different pharmacophore elements, including aromatic ring (red), cation (yellow) and hydrophobic group (green).
Fig. 7
Fig. 7. The molecule generated by PGMG with known inhibitors in the case of scaffold hopping.
Molecules generated by PGMG are shown inside the circle, and their closest active nearest neighbours are shown outside the circle. The colours indicate the pharmacophore features extracted from Lavendustin A: aromatic ring (red), hydrogen bond acceptor (blue) and hydrophobic group (green).

Similar articles

Cited by

References

    1. Lipinski CA, Lombardo F, Dominy BW, Feeney PJ. Experimental and computational approaches to estimate solubility and permeability in drug discovery and development settings. Adv. Drug Deliv. Rev. 1997;23:3–25. - PubMed
    1. Bohacek RS, McMartin C, Guida WC. The art and practice of structure‐based drug design: a molecular modeling perspective. Med. Res. Rev. 1996;16:3–50. - PubMed
    1. Goodnow RA., Jr Hit and lead identification: Integrated technology-based approaches. Drug Discov. Today. Technol. 2006;3:367–375.
    1. Gómez-Bombarelli R, et al. Automatic chemical design using a data-driven continuous representation of molecules. ACS Cent. Sci. 2018;4:268–276. - PMC - PubMed
    1. Jin W, Barzilay R, Jaakkola T. Multi-objective molecule generation using interpretable substructures. Int. Conf. Mach. Learn. 2020;37:4849–4859.

Publication types