. 2023 Oct 6;14(1):5996.
doi: 10.1038/s41467-023-41547-5.

Activity-dependent organization of prefrontal hub-networks for associative learning and signal transformation

Affiliations

Activity-dependent organization of prefrontal hub-networks for associative learning and signal transformation

Masakazu Agetsuma et al. Nat Commun. .

Abstract

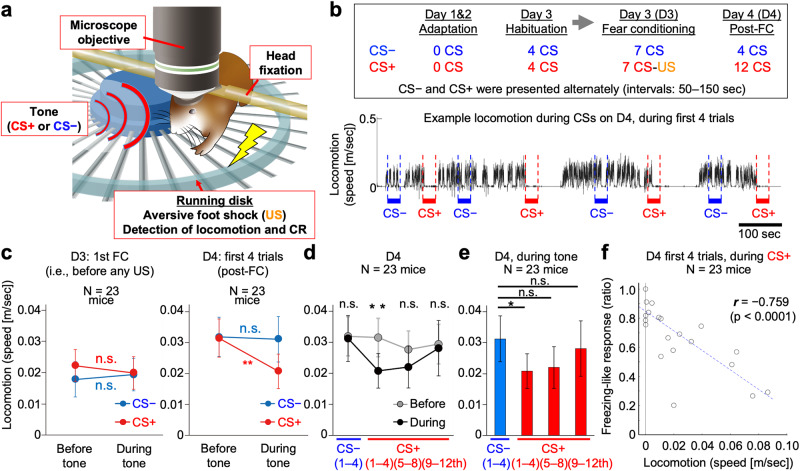
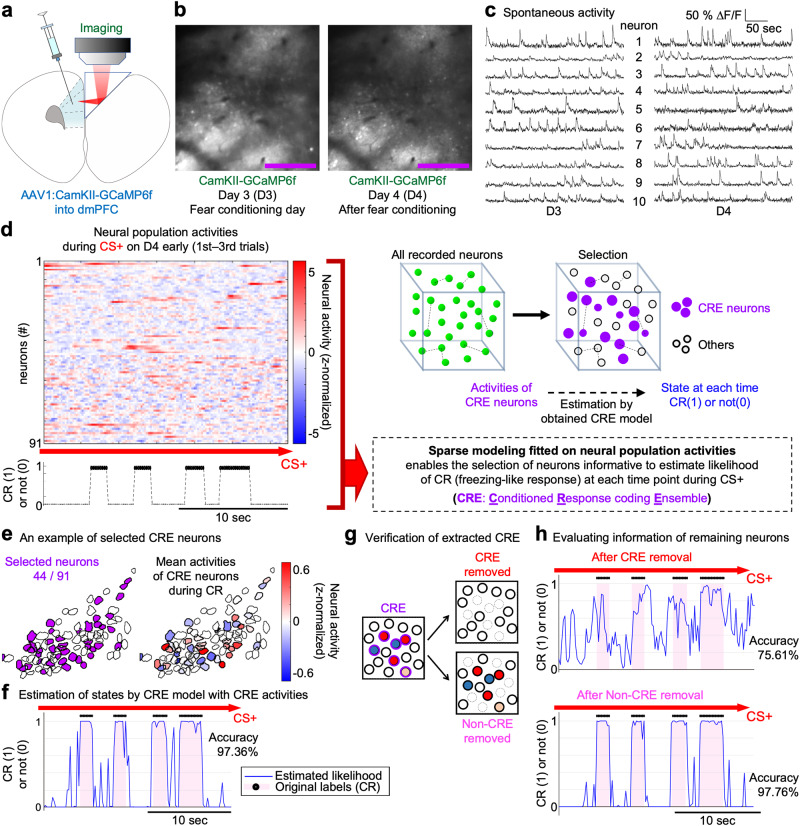
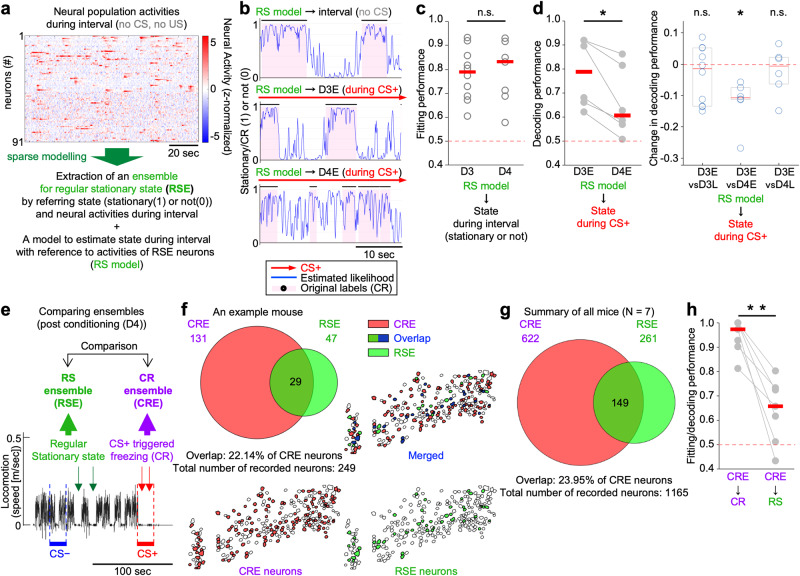
Associative learning is crucial for adapting to environmental changes. Interactions among neuronal populations involving the dorso-medial prefrontal cortex (dmPFC) are proposed to regulate associative learning, but how these neuronal populations store and process information about the association remains unclear. Here we developed a pipeline for longitudinal two-photon imaging and computational dissection of neural population activities in male mouse dmPFC during fear-conditioning procedures, enabling us to detect learning-dependent changes in the dmPFC network topology. Using regularized regression methods and graphical modeling, we found that fear conditioning drove dmPFC reorganization to generate a neuronal ensemble encoding conditioned responses (CR) characterized by enhanced internal coactivity, functional connectivity, and association with conditioned stimuli (CS). Importantly, neurons strongly responding to unconditioned stimuli during conditioning subsequently became hubs of this novel associative network for the CS-to-CR transformation. Altogether, we demonstrate learning-dependent dynamic modulation of population coding structured on the activity-dependent formation of the hub network within the dmPFC.


Conflict of interest statement

The authors declare no competing interests.

Figures

Fig. 1
Fig. 1. Cued-fear conditioning during two-photon microscopy.
a Developed system for cued-fear conditioning under a two-photon microscope. b (top) Experimental protocol. CS, conditioned stimulus; US, unconditioned stimulus; FC, fear conditioning. (bottom) An example of CS+-evoked changes in the locomotion of a mouse on day [D] 4, the day after fear conditioning. See Supplementary Fig. 1 and Methods for details. c, d Locomotor speed before the tone onset and during the tone presentation was compared at different experimental phases. During the first 29 sec of the first trials on D3 (i.e., before any CS+-US pairing), mice (N = 23) exhibited no significant change during the CS+ and CS− presentations (c, left). On D4 (the day after fear conditioning), the CS+ suppressed locomotion as a CR, while the CS− induced no significant change (c, right, and d). After repeated presentations of the CS+ (5th–12th trials on D4), the CRs became smaller until no significant change in locomotion was observed upon CS+ presentation (d). e Statistical comparison between locomotion during CS− and that during CS+ at each testing phase on D4. Locomotion during CS+ was significantly lower only during trials 1–4, and not after repeated presentations to the CS+ (5th–12th trials). The same data shown in d (for “during”) are presented for different statistical comparisons. Note that locomotion during the pre-tone-onset (“before”) was not significantly different between the CS− and CS+ conditions. f Significant correlation between locomotion and freezing-like response (p < 0.0001, Pearson’s correlation test, N = 23). Each circle represents an individual mouse. Blue dotted line, linear fitting. Two-tailed tests for all analyses; *p < 0.05; **p < 0.01; n.s., not significant by Wilcoxon signed-rank test. p = 0.426 for CS− and p = 0.715 for CS+ in c-left; p = 0.465 for CS− and p = 0.0097 for CS+ in c-right; p = 0.465, 0.0097, 0.101, and 0.670 from left to right in d; p = 0.021, 0.078, and 0.465 from left to right in e; p < 0.0001 for f. Error bars, s.e.m. Source data are provided as a Source Data file.
Fig. 2
Fig. 2. Longitudinal in vivo imaging in dmPFC and extraction of the CR ensemble.
a Microprism implantation along the midline for optical access to the dmPFC without cutting nerves. GCaMP6f was expressed in the dmPFC excitatory neurons by the AAV under the CamKII promoter regulation. b In vivo two-photon microscopy to detect activities at the single-cellular resolution visualized by GCaMP6f, chronically (day [D] 3 and D4) from the same set of dmPFC neurons. See also Supplementary Movies 1 and 2. Scale bar, 250 μm. c Longitudinal detection of spontaneous Ca2+ activities on D3 and D4 from 10 example dmPFC neurons. d Extraction procedure for the CR ensemble (CRE). See the Methods for details. e An example of the extracted CRE. (left) Selected neurons. (right) Mean neural activity during CR (freezing-like response) is shown in color. f Time-course changes of neural representation encoded by the CRE (of the one shown in e) under the CS+ presentation on D4 (memory retrieval phase). The plots show a part of the whole length of the data (during the CS+ presentation). Overall estimation accuracy was 97.36% in this example. g Schematic diagram showing how the extracted CRE neurons (circled by the purple lines) were verified through comparison of the fitting performances between CRE removed (when all CRE neurons were removed) and Non-CRE removed (when Non-CR ensemble [Non-CRE] neurons were removed). The fitting performance by the “CRE removed” should be substantially decreased compared with the “Non-CRE removed” if most of the neurons informative for the CR are sufficiently selected as the CRE. h An example of the comparison of the fitting performances, revealing the poor remaining information in the “CRE removed” (in the same mouse analyzed in e and f). d, f, h black dots on the top of the graphs and pink color indicate the timing of the actual CR, while blue lines show the likelihood of locomotion states estimated by the activity of the respective neural populations. As a neural activity, ΔF/F (c) or z-normalized ΔF/F (d and e are shown).
Fig. 3
Fig. 3. Emergence of the unique CR ensemble after fear conditioning.
a Schematic diagram for extracting the RS ensemble (RSE) with building the RS model. As a neural activity, z-normalized ΔF/F is shown. b–d Estimating and decoding locomotion states by the RS model. b In an example mouse, the RS model possessed high performance for estimating RS (day[D]4-interval; top) and decoding locomotion states during CS+ at D3-early (D3E; middle). However, the performance decreased for the locomotion states during CS+ at D4-early (D4E; bottom). c No significant difference in the original RS-model performance between D3 and D4. d (left) Significant decrease in the RS-model decoding performance for locomotion states during CS+ at D4E, compared with D3E. (right) The changes in the decoding performance visualized by subtracting D3E values from others (D3-late [D3L], D4E, D4-late [D4L])). e Schematic diagram for comparing the overlap between the CR ensemble (CRE) and the RSE. f A Venn diagram and a spatial map of an example mouse showing the limited overlap between the CRE and RSE. g Summary of the overlap between the CRE and RSE of all 7 mice (n = 1165 neurons). h The decoding performance of the CR model to the RS was statistically compared with the fitting performance of the CR. Of 11 successfully imaged mice, 7 mice were longitudinally imaged on D3-D4. Because data from 1 of the 7 mice on D3 did not meet the RS-modeling criteria, N = 10 for D3 (c, d); N = 6 for D3-D4 paired comparison (d); N = 7 for D4 (c and Supplementary Fig. 8). The CR models (at D4E) were successfully built in all seven mice (h). The fitting/decoding performances are indicated by the accuracy, while the AUC was similar (Supplementary Fig. 8). Two-tailed, Wilcoxon rank-sum test (c, p = 0.887) and paired permutation tests (d-left, p = 0.016; d-right, p = 0.244, 0.016, 0.531 from left to right; h, p = 0.008) were used. *p < 0.05; **p < 0.01; n.s., not significant. Red bars, median; box in d-right, 25th–75th percentiles. Source data are provided as a Source Data file.
Fig. 4
Fig. 4. Enhanced functional connectivity and CS+ predictability in the CR ensemble with an emergent hub of US-responsive neurons after fear conditioning.
a Functional connectivity in an example neuronal circuit, estimated by the CRF model. Top 50% edge potentials were visualized. b Higher functional connectivity within the CR ensemble (CRE) compared with the others (Non-CRE) during the day[D]4-early (D4E). c Higher decoding performance for CS+ in CRE compared with Non-CRE during D4E. d Enhanced functional connectivity within the CRE in an example circuit after fear conditioning (cf., a; n = 67 CRE neurons marked by red ellipses [left, spatial maps] or black dots [right, functional connectivity scores]). e Changes in functional connectivity and cellular decoding performance (for CS+ and CS−) in CRE, CRE-noRSE (CRE excluding those overlapping with RS ensemble), or Non-CRE, evaluated by calculating D4E-D3E differences (N = 7 mice, 2000 times bootstrap resampling). f, g dmPFC neuronal responses to the US on D3. Neural activities (mean over seven trials) were aligned at the US onset ordered by the magnitude of response for 1.5 sec from the US onset. As neural activity, z-normalized ΔF/F is shown. Green dotted lines, US onset; yellow bar, 1-sec US presentation. f (top) All neurons. (middle) US-responsive neurons (USR). (bottom) Mean ± s.e.m. of respective categories. g US responses of CRE or Non-CRE. h US-responsive neurons on D3 were predominantly involved in the CRE or CRE-noRSE on D4. ik Comparison of functional connectivity scores (ij) and CS+-decoding performances (k) between USR and others (NonUSR) at D4E (i, k), or between D3E and D4E (j), either within the CRE or Non-CRE. N = 7 mice in Fig. 4 (except for a, d). Two-tailed, paired permutation test (b, p = 0.016; c, p = 0.016), bootstrap resampling-based analysis (e: p < 0.001, < 0.001, 0.013, 0.006, 0.411 and 0.270, left to right), Fisher’s exact test (h: top, p = 0.001; bottom, p = 0.008), Wilcoxon rank-sum test (i: CRE, p = 0.020; Non-CRE, p = 0.999; k: CRE, p = 0.001; non-CRE, p = 0.350), and Wilcoxon signed-rank test (d: p < 0.0001; j: CRE, p = 0.003; Non-CRE, p = 0.554) were used. *p < 0.05; **p < 0.01; ***p < 0.001; ****p < 0.0001; n.s., not significant. Red bars, median; boxes in d, e, ik indicate 25th–75th percentiles. See Methods and Source Data for details.

Similar articles

Cited by

References

    1. Pavlov PI. Conditioned reflexes: an investigation of the physiological activity of the cerebral cortex. Ann. Neurosci. 2010;17:136–141. doi: 10.5214/ans.0972-7531.1017309. - DOI - PMC - PubMed
    1. Watson JB, Rayner R. Conditioned emotional reactions. J. Exp. Psychol. 1920;3:1–14. doi: 10.1037/h0069608. - DOI - PubMed
    1. Josselyn SA, Tonegawa S. Memory engrams: recalling the past and imagining the future. Science. 2020;367:eaaw4325. doi: 10.1126/science.aaw4325. - DOI - PMC - PubMed
    1. Miller EK, Cohen JD. An integrative theory of prefrontal cortex function. Annu. Rev. Neurosci. 2001;24:167–202. doi: 10.1146/annurev.neuro.24.1.167. - DOI - PubMed
    1. Calhoon GG, Tye KM. Resolving the neural circuits of anxiety. Nat. Neurosci. 2015;18:1394–1404. doi: 10.1038/nn.4101. - DOI - PMC - PubMed

Publication types