. 2023 Oct 6;13(1):16863.
doi: 10.1038/s41598-023-43983-1.

Amino acid transporter SLC38A5 is a tumor promoter and a novel therapeutic target for pancreatic cancer

Affiliations

Amino acid transporter SLC38A5 is a tumor promoter and a novel therapeutic target for pancreatic cancer

Tyler Sniegowski et al. Sci Rep. .

Abstract

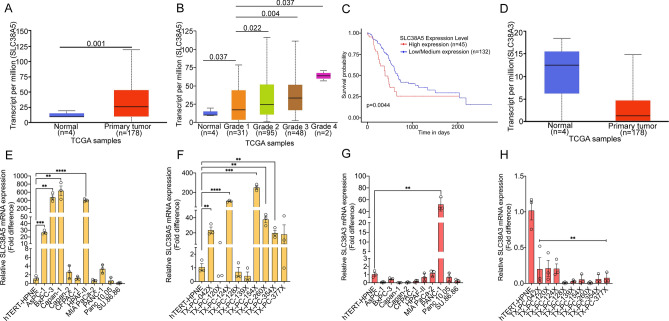
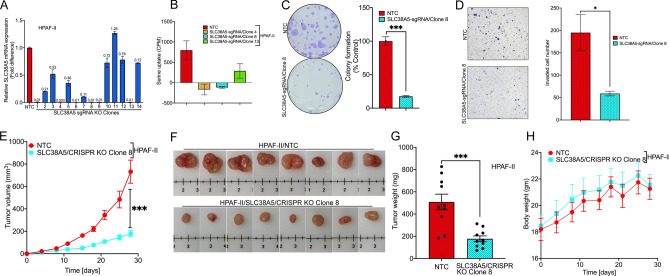
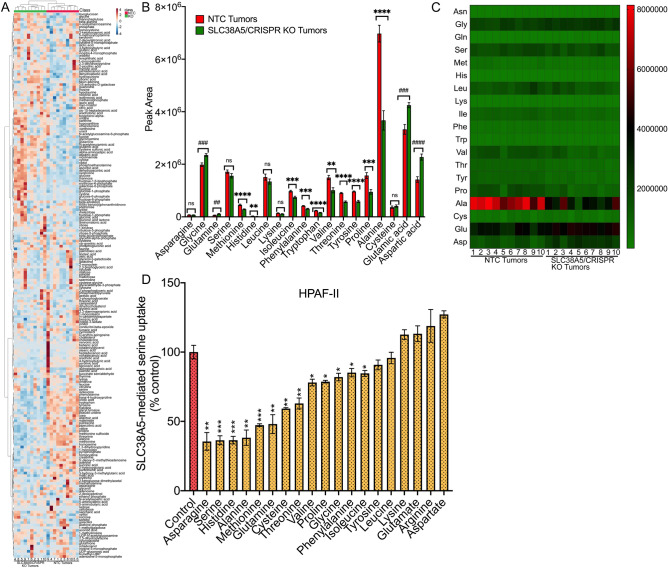
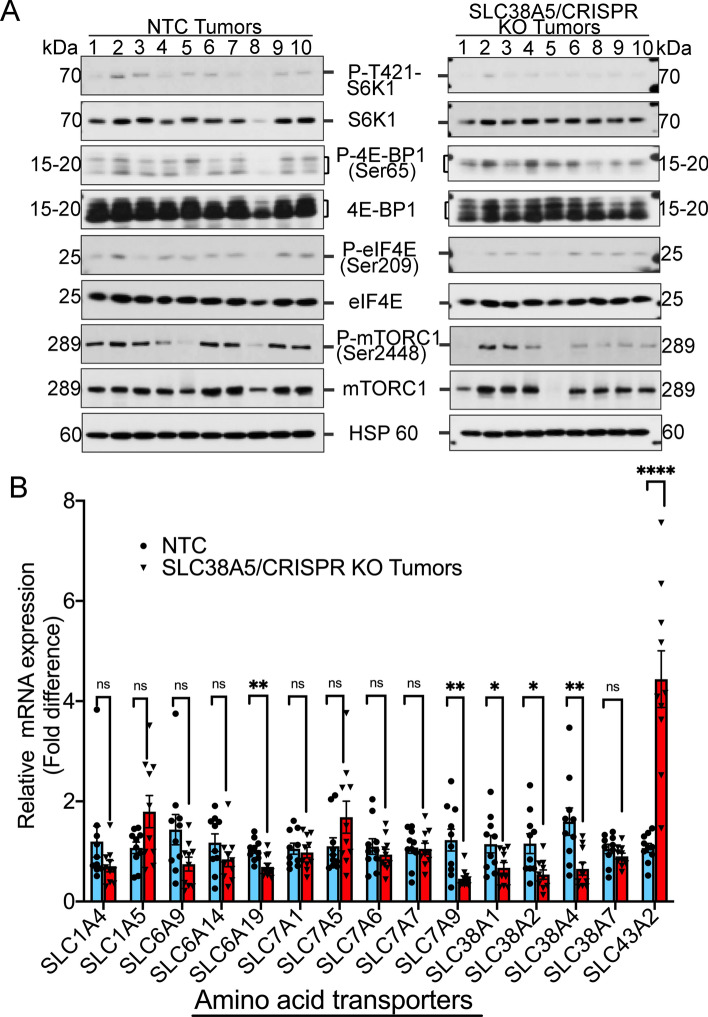
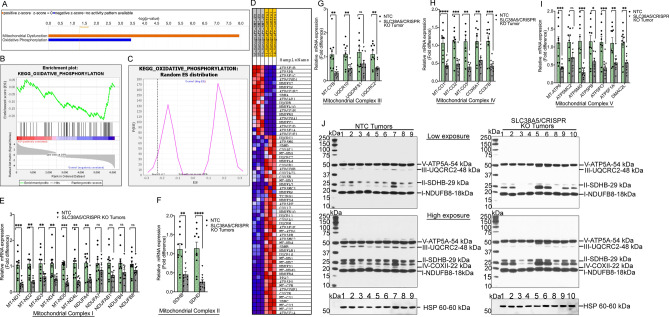
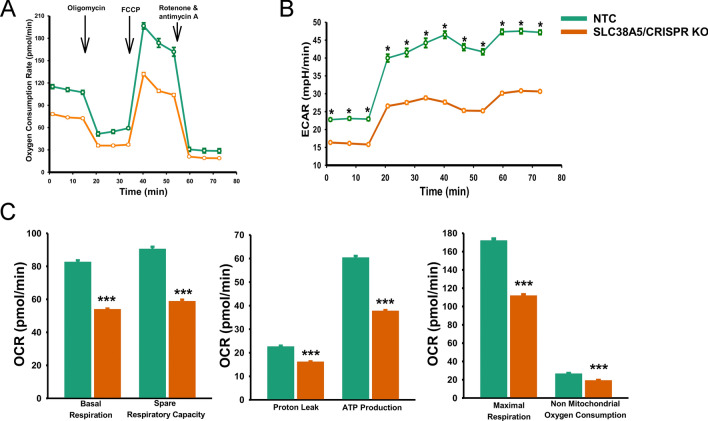
Pancreatic ductal adenocarcinoma (PDAC) cells have a great demand for nutrients in the form of sugars, amino acids, and lipids. Particularly, amino acids are critical for cancer growth and, as intermediates, connect glucose, lipid and nucleotide metabolism. PDAC cells meet these requirements by upregulating selective amino acid transporters. Here we show that SLC38A5 (SN2/SNAT5), a neutral amino acid transporter is highly upregulated and functional in PDAC cells. Using CRISPR/Cas9-mediated knockout of SLC38A5, we show its tumor promoting role in an in vitro cell line model as well as in a subcutaneous xenograft mouse model. Using metabolomics and RNA sequencing, we show significant reduction in many amino acid substrates of SLC38A5 as well as OXPHOS inactivation in response to SLC38A5 deletion. Experimental validation demonstrates inhibition of mTORC1, glycolysis and mitochondrial respiration in KO cells, suggesting a serious metabolic crisis associated with SLC38A5 deletion. Since many SLC38A5 substrates are activators of mTORC1 as well as TCA cycle intermediates/precursors, we speculate amino acid insufficiency as a possible link between SLC38A5 deletion and inactivation of mTORC1, glycolysis and mitochondrial respiration, and the underlying mechanism for PDAC attenuation. Overall, we show that SLC38A5 promotes PDAC, thereby identifying a novel, hitherto unknown, therapeutic target for PDAC.


Conflict of interest statement

The authors declare no competing interests.

Figures

Figure 1
Figure 1
SLC38A5 is upregulated in PDAC and affects overall patient survival. (A) Box plot map showing TPM-normalized expression of SLC38A5 in normal tissues and pancreatic adenocarcinoma (PAAD). (B) Box plot map showing TPM normalized expression of SLC38A5 in normal tissues and pancreatic adenocarcinoma (PAAD) by tumor grade. (C) Kaplan–Meier plot showing survival probability between high and low SLC38A5 expression in pancreatic cancer. The result was generated from the online tool UALCAN (http://ualcan.path.uab.edu). Significance of survival impact is measured by log-rank test. (D) Box-plot map showing TPM-normalized expression of SLC38A3 in normal tissues and pancreatic adenocarcinoma (PAAD). Data derived from the TCGA database. (E) Real-time PCR showing relative mRNA expression of SLC38A5 in hTERT-HPNE (normal pancreatic epithelial cell line) and 10 PDAC cell lines. 18S was used as an endogenous control. (F) Real-time PCR showing relative SLC38A5 mRNA expression in hTERT-HPNE normal pancreatic cell line and 10 patient-derived xenografts (PDXs). (G) Real-time PCR showing relative mRNA expression of SLC38A3 in hTERT-HPNE (normal pancreatic epithelial cell line) and 10 PDAC cell lines. 18S was used as an endogenous control. (D) Real-time PCR showing relative SLC38A5 mRNA expression in hTERT-HPNE normal pancreatic cell line and 10 patient-derived xenografts (PDXs). Data are given as mean ± SEM. **p < 0.01, ***p < 0.001, ****p < 0.0001.
Figure 2
Figure 2
SLC38A5 is upregulated in PDAC organoids. (A) Phase-contrast image of hN31 normal pancreatic organoid and hT1 PDAC organoid at × 10 magnification. (B,C) Real-time PCR showing relative SLC38A5 and SLC38A3 mRNA expression in hN31 normal pancreatic organoid line and 5 PDAC organoid lines. Data are means ± SEM. (D) Immunocytochemical detection of SLC38A5 (green) in normal pancreatic organoid (hN31) and PDAC organoid (hT1). Nuclei stained with DAPI are blue. Magnification, × 60.
Figure 3
Figure 3
SLC38A5 is functional in PDAC cell lines. (A–C) SLC38A5-mediated 3H-serine uptake, 3H-glutamine uptake and 3H-glycine uptake in AsPC-1, BxPC-3, Capan-1, and HPAF-II PDAC cell lines. The uptake was conducted in LiCl or NMDG-Cl buffer containing 2.5 mM tryptophan at pH 8.5. Data are given as mean ± SEM. *p < 0.05, **p < 0.01, ***p < 0.001.
Figure 4
Figure 4
CRISPR/Cas9-mediated knockout of SLC38A5 and its tumor promoting role in vitro cell line models as well as in in vivo xenograft mouse models. (A) Real-time PCR of SLC38A5 mRNA expression in HPAF-II/NTC compared to HPAF-II/SLC38A5 CRISPR KO clones. (B) [3H]-Serine uptake in HPAF-II/NTC and three SLC38A5 CRISPR KO clones in LiCl buffer containing 2.5 mM tryptophan at pH 8.5. (C) Colony formation assay along with quantification in HPAF-II/NTC and HPAF-II/SLC38A5 KO clone 8. (D) Representative image (magnification × 10) of invasion assay along with cell count performed with HPAF-II/NTC and HPAF-II/SLC38A5 KO clone 8. (E) Tumor growth curves of HPAF-II/NTC and SLC38A5/KO clone 8 implanted as xenografts into athymic nude mice. (F) Representative photographs of harvested tumors from mice bearing HPAF-II/NTC and SLC38A5/KO clone 8. (G) End of study tumor weights between mice bearing HPAF-II/NTC and HPAF-II/SLC38A5 KO clone 8. (H) Body weights of mice xenografted with HPAF-II/NTC and HPAF-II/SLC38A5 KO clone 8. Data are given as mean ± SEM. *p < 0.05, ***p < 0.001.
Figure 5
Figure 5
Metabolite profiling reveals significant downregulation of many amino acid substrates of SLC38A5 in response to SLC38A5 knockout. (A) Hierarchical clustering heatmap of metabolites from NTC tumors and SLC38A5/CRISPR KO tumor as analyzed by MetaboAnalyst 4.0. (B) Amino acid peaks between the NTC tumors and the SLC38A5/CRIPSR KO tumors from the metabolomic analysis. (C) Heatmap representation of the amino acid peak between the NTC tumors and the SLC38A5/CRIPSR KO tumors from the metabolomic analysis. (D) [3H]-Serine uptake in HPAF-II cells showing amino acid substrate selectivity. The uptake was conducted using LiCl buffer containing 5 mM tryptophan at pH 8.5, either in the presence or absence of 5 mM of various amino acids. Uptake measured in NMDG-Cl buffer was subtracted from the uptake measured in the presence of LiCl (with or without the competing amino acid) in order to calculate the Li+-coupled uptake. Data are given as mean ± SEM. NS non-significant, *p < 0.05, **p < 0.01, ***p < 0.001, ****p < 0.0001, ##p < 0.01, ###p < 0.001, ####p < 0.0001.
Figure 6
Figure 6
SLC38A5 knockout inhibits mTORC1 signaling pathway and is not associated with a compensatory upregulation of other amino acid transporters. (A) Western blotting showing evaluation of mTORC1 and its downstream targets (both phosphorylated and total) in NTC tumors and SLC38A5/CRISPR KO tumors. HSP 60 was used as an endogenous control. (B) Real-time PCR showing mRNA expression of 15 amino acid transporters in NTC tumors and SLC38A5/CRISPR KO tumors. Data are given as mean ± SEM. NS non-significant, *p < 0.05, **p < 0.01, ****p < 0.0001.
Figure 7
Figure 7
RNA sequencing reveals significant impact on oxidative phosphorylation following SLC38A5 knockout. (A) Ingenuity Pathway Analysis plot for the top 2 canonical pathways out of the 20 enriched pathways as analyzed by the IPA software. Positive z-score shown in orange identifies activated pathway and negative z-score in blue color specifies inhibited pathways after CRISPR-mediated knockout of SLC38A5. (B,C) Gene set enrichment analysis (GSEA) plot and random ES distribution plot showing changes in oxidative phosphorylation pathway following CRISPR-mediated knockout of SLC38A5. (D) Heatmap of genes associated with oxidative phosphorylation, either upregulated or downregulated in SN2-KO (SLC38A5/KO) tumors when compared to control tumors. (E–I) Real-time PCR showing relative mRNA expression of genes related to mitochondrial complex I, II, III, IV, and V. (J) Western blotting showing protein levels from each of the five mitochondrial respiratory complexes i.e., NDUFB8 (Complex I), SDHB (Complex II), UQCRC2 V (Complex III), COXII (Complex IV), and ATP5A (Complex V). HSP 60 was used as the endogenous control. Data are given as mean ± SEM. NS non-significant, *p < 0.05, **p < 0.01, ***p < 0.001, ****p < 0.0001.
Figure 8
Figure 8
Mitochondrial bioenergetic state in NTC cells compared to SLC38A5/CRISPR KO cells. (A) Kinetic OCR (oxygen consumption rate) response of NTC and SLC38A5/CRISPR KO cells to oligomycin (2 µM) to determine ATP coupled respiration, FCCP (1 µM) to determine maximal respiration, and rotenone and antimycin A (0.5 µM) to define spare respiratory capacity. Cells were plated at 2 × 104/well overnight prior to the assays. The OCR values were reported to pmol/min. Each data point represents mean ± SEM. (B) Kinetic ECAR (Extracellular Acidification Rate) response of NTC and SLC38A5/CRISPR KO cells to oligomycin (2 µM), FCCP (1 µM), and rotenone and antimycin A (0.5 µM). Cells were plated at 2 × 104/well overnight prior to the assays. The ECAR values were reported as mpH/min. Each data point represents mean ± SEM. *p < 0.001. (C) Graphs represent calculated basal respiration, spare respiratory capacity, proton leak-linked respiration, ATP production, maximal mitochondrial respiration and non-mitochondrial oxygen consumption. OCR values are expressed as pmol/min. Graphs represent the mean ± SEM. ***p < 0.001.

Similar articles

Cited by

References

    1. Xu R, Yang J, Ren B, Wang H, Yang G, Chen Y, et al. Reprogramming of amino acid metabolism in pancreatic cancer: Recent advances and therapeutic strategies. Front. Oncol. 2020;10:572722. doi: 10.3389/fonc.2020.572722. - DOI - PMC - PubMed
    1. Wei Z, Liu X, Cheng C, Yu W, Yi P. Metabolism of amino acids in cancer. Front. Cell Dev. Biol. 2020;8:603837. doi: 10.3389/fcell.2020.603837. - DOI - PMC - PubMed
    1. Lee JH, Cho YR, Kim JH, Kim J, Nam HY, Kim SW, et al. Branched-chain amino acids sustain pancreatic cancer growth by regulating lipid metabolism. Exp. Mol. Med. 2019;51:1–11. doi: 10.1038/s12276-019-0299-y. - DOI - PMC - PubMed
    1. Vettore L, Westbrook RL, Tennant DA. New aspects of amino acid metabolism in cancer. Br. J. Cancer. 2020;122:150–156. doi: 10.1038/s41416-019-0620-5. - DOI - PMC - PubMed
    1. Saito Y, Soga T. Amino acid transporters as emerging therapeutic targets in cancer. Cancer Sci. 2021;112:2958–2965. doi: 10.1111/cas.15006. - DOI - PMC - PubMed

Publication types

Substances