. 2023 Oct 6;9(1):48.
doi: 10.1038/s41540-023-00309-1.

Understanding and leveraging phenotypic plasticity during metastasis formation

Affiliations

Understanding and leveraging phenotypic plasticity during metastasis formation

Saumil Shah et al. NPJ Syst Biol Appl. .

Abstract

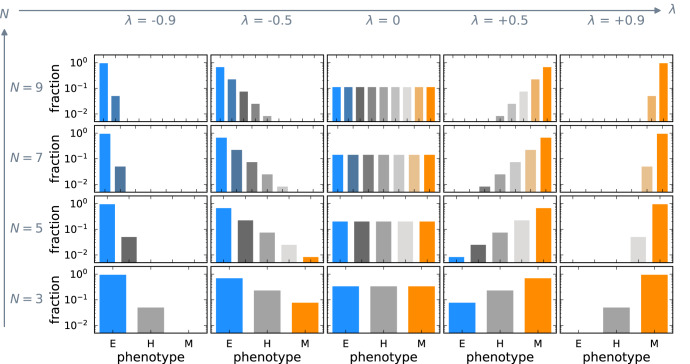
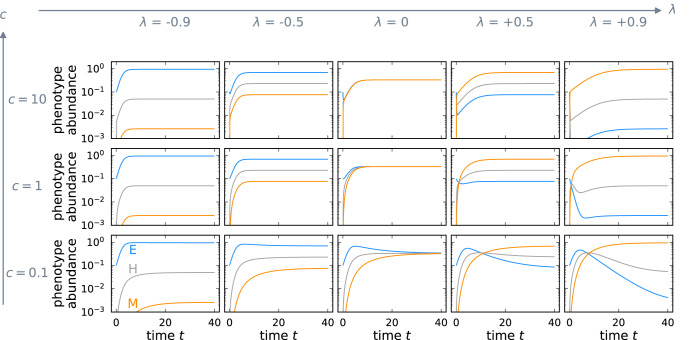
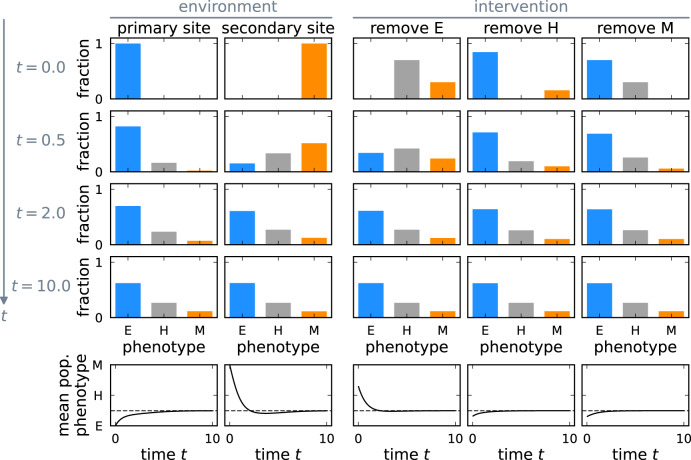
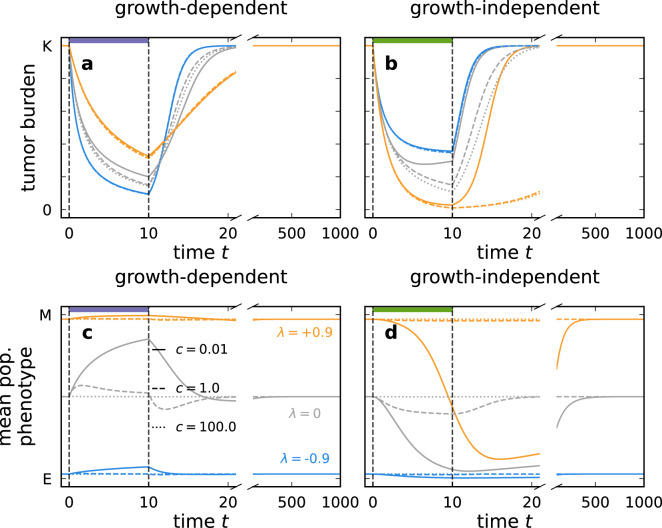
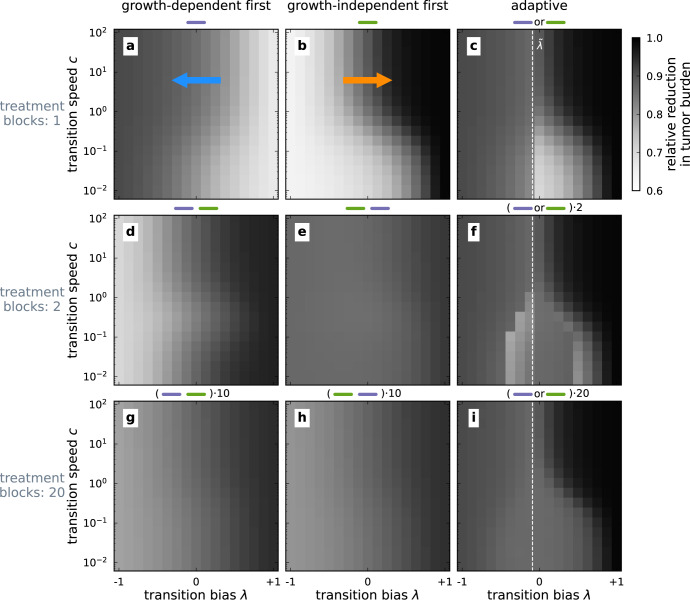
Cancer metastasis is the process of detrimental systemic spread and the primary cause of cancer-related fatalities. Successful metastasis formation requires tumor cells to be proliferative and invasive; however, cells cannot be effective at both tasks simultaneously. Tumor cells compensate for this trade-off by changing their phenotype during metastasis formation through phenotypic plasticity. Given the changing selection pressures and competitive interactions that tumor cells face, it is poorly understood how plasticity shapes the process of metastasis formation. Here, we develop an ecology-inspired mathematical model with phenotypic plasticity and resource competition between phenotypes to address this knowledge gap. We find that phenotypically plastic tumor cell populations attain a stable phenotype equilibrium that maintains tumor cell heterogeneity. Considering treatment types inspired by chemo- and immunotherapy, we highlight that plasticity can protect tumors against interventions. Turning this strength into a weakness, we corroborate current clinical practices to use plasticity as a target for adjuvant therapy. We present a parsimonious view of tumor plasticity-driven metastasis that is quantitative and experimentally testable, and thus potentially improving the mechanistic understanding of metastasis at the cell population level, and its treatment consequences.


Conflict of interest statement

The authors declare no competing interests.

Figures

Fig. 1
Fig. 1. Model structure capturing phenotypic heterogeneity at the primary and secondary tumor site.
We focus on the competitive growth of heterogeneous tumor cell populations at each tumor site. The dashed arrow represents spread of cancer cells between the primary and secondary sites. We do not model the spread between tumor sites explicitly, but consider the spread as translating into different initial phenotype distributions at primary and secondary sites. The different compartments in the model for each site represent epithelial, hybrid, and mesenchymal phenotypes. The solid arrows indicate competitive growth and phenotype transitions. Phenotype i grows at rate ri and transitions to the adjacent more mesenchymal-like type at rate TEM and to the adjacent more epithelial-like type at rate TME. Resource competition is modeled with the term riXK where X=j=1Nxj is the total population abundance, and K is the carrying capacity. The epithelial phenotype can only transition to the more mesenchymal-like adjacent hybrid phenotype, and the mesenchymal phenotype can only transition to the epithelial-like adjacent hybrid phenotype; thus, the epithelial and mesenchymal phenotypes are the terminal phenotypes. Here, we show only one hybrid phenotype, but we also investigate the effect of a larger number of hybrid phenotypes.
Fig. 2
Fig. 2. Phenotypic plasticity creates a stable phenotype distribution.
Each panel shows the distribution of phenotypes (Eq. (1)) relative to the carrying capacity K for a fixed value of the transition bias λ and the number of phenotypes N. The stable phenotype distribution changes with the transition bias λ but remains qualitatively unaffected by changing the number of phenotypes N. The stable distribution is uniform when there is no transition bias to either epithelial or mesenchymal-like phenotypes, i.e., λ = 0. λ < 0 depicts a transition bias towards epithelial-like phenotypes and leads to a relative increase in epithelial cells. Conversely, λ > 0 results in a transition bias towards mesenchymal-like phenotypes and causes a relative increase in mesenchymal cells.
Fig. 3
Fig. 3. Transition speed determines the rate of approach to the stable phenotype distribution.
The panels show the approach to the stable phenotype distribution from the same initial condition, (x1,x2,x3)=(110,0,0), for different combinations of transition speed c and transition bias λ. The transition speed c sets the pace of the transition dynamics relative to the growth dynamics. For any transition bias λ, the time to reach the stable phenotype distribution decreases as the transition speed increases.
Fig. 4
Fig. 4. Plasticity-driven approach to stable phenotype distribution from different initial conditions.
Depending on the initial condition, the approach to the stable phenotype distribution proceeds along different paths (top four rows, the vertical axis represents time). The mean population phenotype over time is shown in the last row with its asymptote (dashed line). The first column shows the phenotype dynamics of a plastic tumor at the primary site, where it originates only from epithelial cells. The second column represents the growth of a metastasis after mainly mesenchymal cells have arrived at the secondary site. The last three columns show the dynamics after a hypothetical intervention that removes all epithelial, all hybrid, or all mesenchymal cells. In all cases, the tumor approaches the stable phenotype distribution; however, different initial conditions lead to shifting the average phenotype in different directions.
Fig. 5
Fig. 5. Growth-dependent and growth-independent treatment can transiently alter the phenotype distribution of a tumor.
During treatment, the tumor burden shrinks (a, b), and the mean phenotype of the tumor changes if the transition speed c is small but restores to the untreated mean phenotype value after treatment (c, d). Treatment is applied between t = 0 and t = 10. Afterward, regrowth is tracked until t = 1000. The violet and green horizontal bars indicate growth-dependent and growth-independent treatments. Growth-dependent treatment shifts the mean of the phenotype distribution towards the mesenchymal phenotype as it exerts higher mortality on epithelial cells. Conversely, growth-independent treatment shifts the mean towards the epithelial phenotype as epithelial cells compensate for the mortality by faster growth.
Fig. 6
Fig. 6. Reduction in tumor burden for different sequential treatment schemes.
The reduction in tumor burden relative to the carrying capacity KXK is indicated by the brightness gradient for different combinations of transition bias λ and transition speed c. Here, X is the sum of phenotype abundances at the end of treatment duration (N = 3). Darker colors represent a higher reduction and, thus, a better outcome. We evaluate the effect of splitting the treatment period into multiple treatment blocks (rows) and investigate different treatment schemes with either predefined or adaptive treatment sequences (columns). The white dashed line indicates a decision boundary λ~ for the adaptive treatment, which is obtained by comparing the mortality of the two treatment types (see text). Adjuvant therapy can alter the phenotype transitions, which in our model translates to changes, for example, to the transition bias λ, indicated by the arrows in panels a and b.

References

    1. Dillekås H, Rogers MS, Straume O. Are 90% of deaths from cancer caused by metastases? Cancer Med. 2019;8:5574–5576. - PMC - PubMed
    1. Siegel RL, Miller KD, Jemal A. Cancer statistics, 2020. Cancer J. Clin. 2020;70:7–30. - PubMed
    1. Sung H, et al. Global Cancer Statistics 2020: GLOBOCAN Estimates of Incidence and Mortality Worldwide for 36 Cancers in 185 Countries. Cancer J. Clin. 2021;71:209–249. - PubMed
    1. Gupta GP, Massagué J. Cancer metastasis: building a framework. Cell. 2006;127:679–695. - PubMed
    1. Weinberg, R. A. The Biology of Cancer 2nd edn (Garland Science, Taylor & Francis Group, 2014). ISBN 978-0-8153-4219-9 978-0-8153-4220-5.

Publication types