. 2023 Oct 6;6(1):1015.
doi: 10.1038/s42003-023-05324-w.

Dicalcin suppresses invasion and metastasis of mammalian ovarian cancer cells by regulating the ganglioside-Erk1/2 axis

Affiliations

Dicalcin suppresses invasion and metastasis of mammalian ovarian cancer cells by regulating the ganglioside-Erk1/2 axis

Naofumi Miwa et al. Commun Biol. .

Abstract

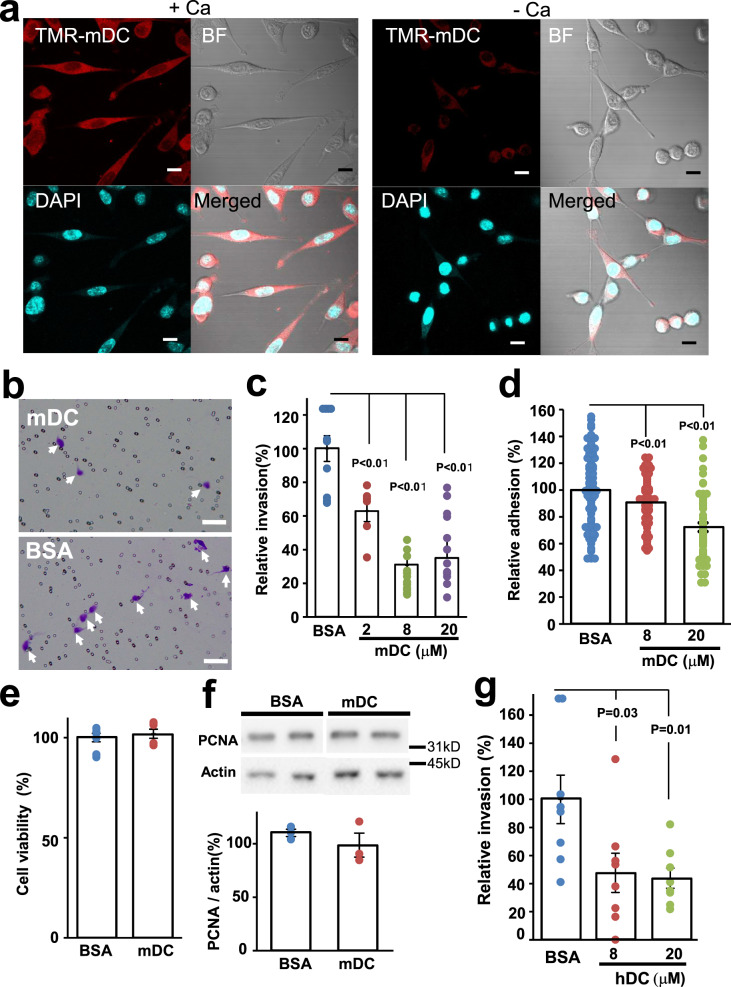
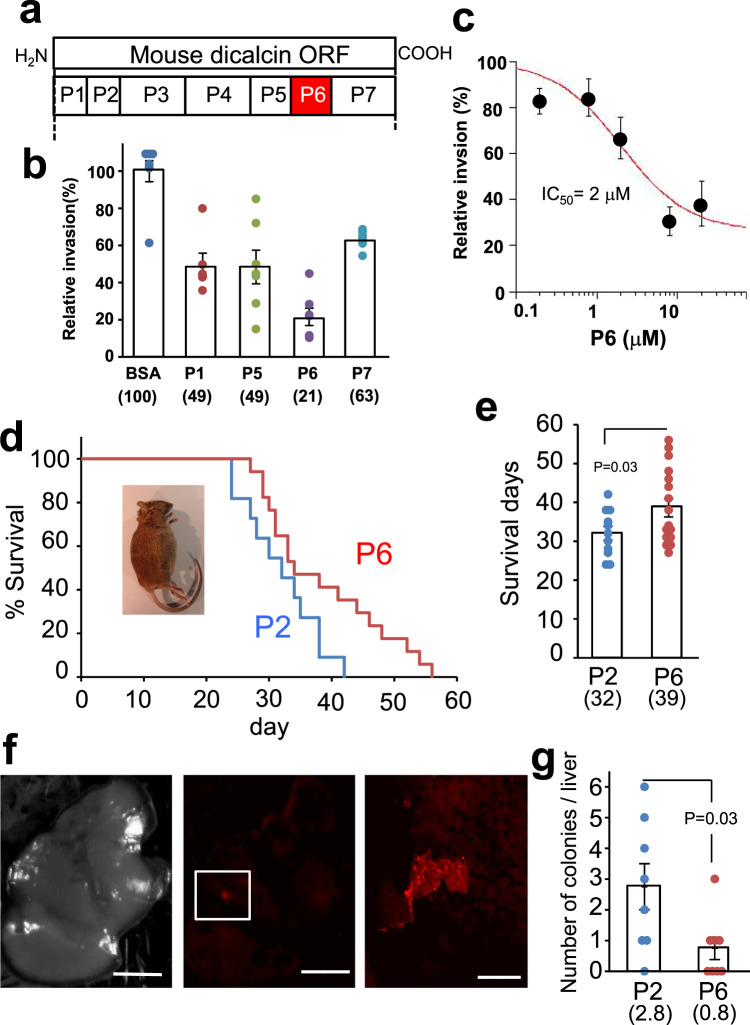
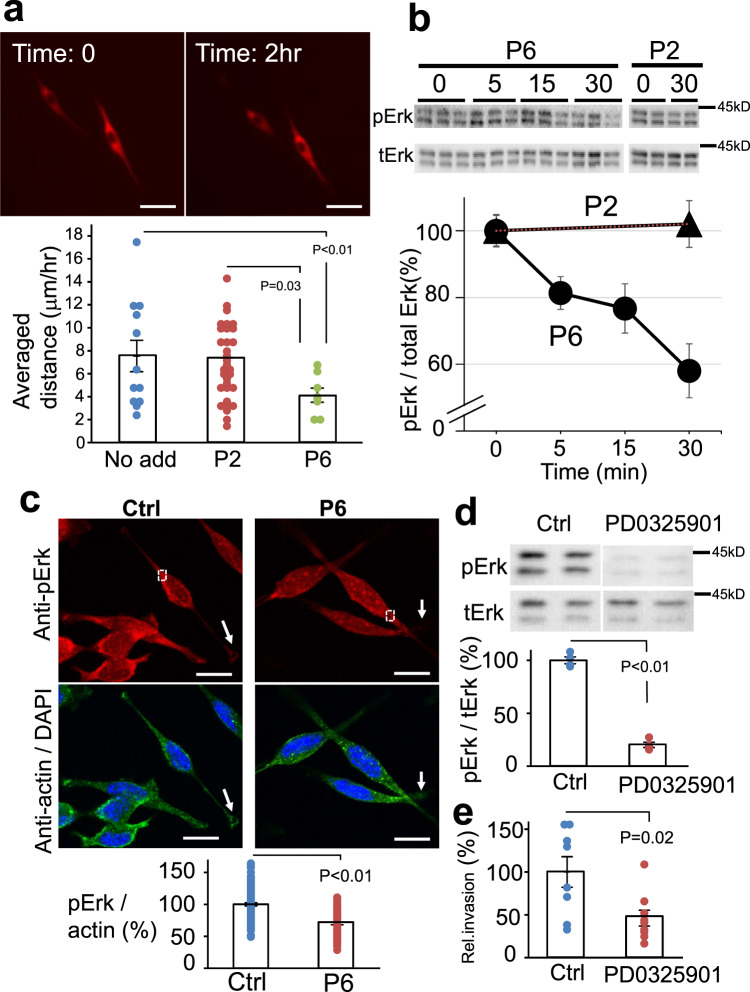
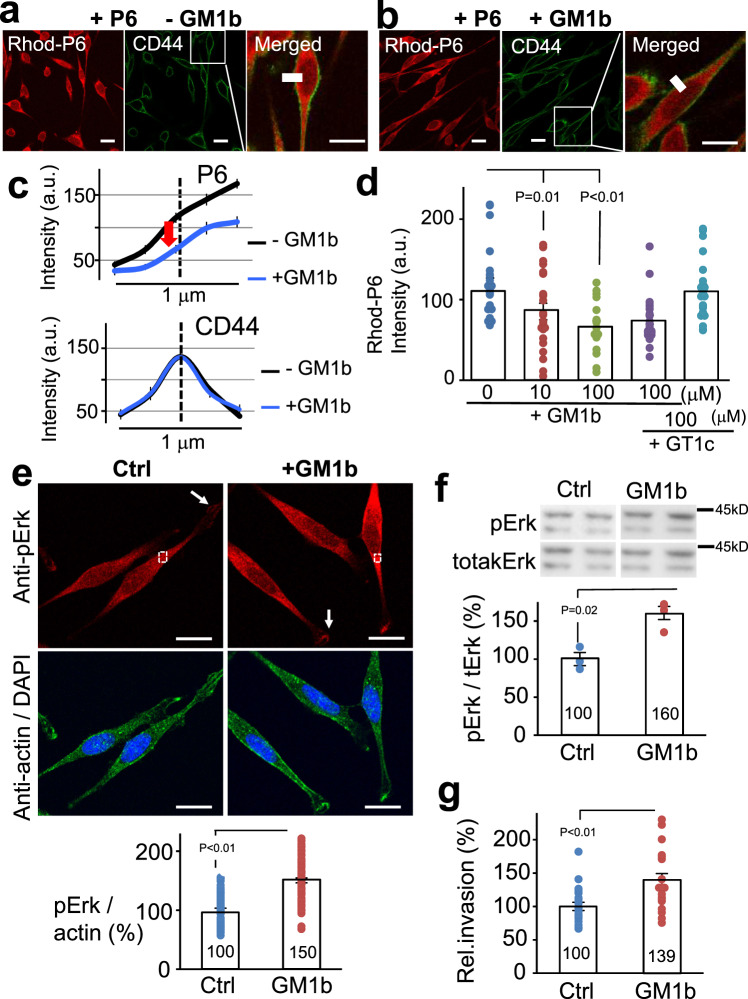
Metastasis, a multistep process including cancer cell migration and invasion, is the major cause of mortality in patients with cancer. Here, we investigated the effect of dicalcin, a Ca2+-binding protein, on the invasion and metastasis of ovarian cancer (OC) cells. Extracellularly administered dicalcin bound to the membrane of OV2944 cells, mouse OC cells, and suppressed their migration in vitro; however, cell viability or proliferation were unaffected. Repeated intraperitoneal injection of a partial peptide of dicalcin (P6) prolonged the survival, and reduced the number of microcolonies in the livers of cancer-bearing mice. P6 bound to the ganglioside GM1b in a solid-phase assay; treatment with P6 inhibited the constitutive activation of Erk1/2 in OC cells, whereas excess administration of GM1b augmented Erk activity and cancer cell migration in vitro. Thus, dicalcin, a novel suppressor of invasion and metastasis of OC cells, acts via the GM1b-Erk1/2 axis to regulate their migration.


Conflict of interest statement

N.M. and M.H. hold the patent for anti-metastasis agent. Patent name: Human cancer cell metastasis inhibitory agent and human cancer cell determination agent. Patent number: P7045042 region: Japan; Patent number: US-11696938-B2 region: US. The remaining authors declare no competing interests.

Figures

Fig. 1
Fig. 1. Inhibition of in vitro invasion of mouse and human ovarian tumor cells by dicalcin.
a Binding of exogenously administered dicalcin to OV2944 cells. TMR-labeled dicalcin bound to OV2944 cells in the presence of 1 mM Ca2+ (+Ca), but not in the presence of 3 mM EGTA (−Ca). Scale: 10 μm. b In vitro invasion assay. Upper: Representative images of OV2944 cells that migrated through Matrigel-coated membrane, followed by pretreatment with 20 μM mouse dicalcin (mDC). Lower: In vitro invasion assay of OV2944 cells pretreated with bovine serum albumin (BSA). Scale: 50 μm. c In vitro invasion assay. Exogenously administered dicalcin suppressed in vitro invasion of OV2944 cells in a dose-dependent manner. The invasion activity for BSA treatment was set to 100% and the data were normalized. The bar graph shows mean data (n = 6–13, mean ± s.e.m). Circles show individual data. p values represent unpaired Student’s t-test. d In vitro adhesion assay of OV2944 cells. Pretreated OV2944 cells with dicalcin were loaded on the plate, and cells on the plate were fixed and stained. After washing with phosphate buffer saline (PBS) to remove unattached cells, the number of cells were counted and normalized. Exogenously administered dicalcin suppressed in vitro adhesion of OV2944 cells to the matrix in a dose-dependent manner. The bar graph shows mean data (n = 64–105, mean ± s.e.m). Circles show individual data. p values represent unpaired Student’s t-test. e Effect of dicalcin on the cell viability. OV2944 cells following treatment with 10 μM dicalcin or BSA were used for MTT assay. The fluorescent data (OD560) was normalized and evaluated. The bar graph shows mean data (BSA, n = 10; mDC, n = 6; mean ± s.e.m). Circles show individual data. f Effect of dicalcin on the cell proliferation. OV2944 cells following treatment with 10 μM dicalcin or BSA were analyzed by western blot using an anti-PCNA antibody. The bar graph shows mean data of the intensities of the blots (n = 3, mean ± s.e.m). Circles show individual data. g In vitro invasion assay of OVCAR-3 cells. Exogenously administered human dicalcin (hDC) suppressed in vitro invasion of OVCAR-3 cells in a dose-dependent manner. The invasion activity for BSA treatment was set to 100% and the data were normalized. The bar graph shows mean data (n = 8, mean ± s.e.m). Circles show individual data. p values represent the results of the unpaired Student’s t-test.
Fig. 2
Fig. 2. Identification of the amino acid region that is responsible for the suppressive action of dicalcin on OV2944 invasivity.
a Mapping of partial amino acid region and synthetic peptides. The primary sequence of mouse dicalcin was divided into seven regions. Binding activities of seven regions of dicalcin to OV2944 cells were examined. The amino acid region that corresponds to the peptide with the most intense binding is highlighted. b In vitro invasion assay using synthetic peptides. Synthetic peptides bearing higher binding activities (P1, P5, P6, P7) were examined for in vitro invasion assay using OV2944 cells. Exogenously administered P6 showed a robust suppression of in vitro invasion. Numbers in the parentheses represent averaged values in each condition. The bar graph shows mean data (n = 6–8, mean ± s.e.m). Circles show individual data. c Dose-dependency of suppressive effect of P6 on in vitro invasion. Exogenously administered P6 exhibits a dose-dependent suppression of in vitro invasion of OV2944 cells (n = 10–20). d Survival rate of tumor-transfected mice. B6C3F1 mice were intraperitoneally injected with OV2944 cells (1 × 105 cells) that were pretreated either with 10 μM P6 or P2. Following cell injection, mice were intraperitoneally injected with the appropriate peptide until the end of the study (injection dose and schedule: 3 nmol/150 μl/2 days, Supplementary Fig. 15). The survival of transfected mice was evaluated by Kaplan–Meier analysis. Inset photo: sacrificed mice developed a large quantity of ascites. e Averaged survival days of cancer-bearing mice. Numbers in the parentheses represent averaged values in each condition. The bar graph shows mean data (P2, n = 11; P6, mean ± s.e.m., n = 17, unpaired Student’s t-test). Circles show individual data. f Reduced micrometastasis in P6-treated mice. Mice were i.p. injected with OV2944 cells expressing tdTomato and repeatedly injected with the appropriate peptide. After 20 days, cell-injected mice were sacrificed; the location of metastasis in the liver was observed with in vivo imaging microscope (Left, bright field image of the liver, Scale, 5 mm; Middle, fluorescent image of the liver, Scale, 5 mm; Right, enlarged image of the colony indicated in the square of the middle, Scale, 1 mm). g The average number of colonies was decreased in P6-treated mice, compared with that for P2-treated mice. Numbers in the parentheses represent averaged values in each condition. The bar graph shows mean data (mean ± s.e.m., n = 8, unpaired Student’s t-test). Circles show individual data.
Fig. 3
Fig. 3. Dicalcin-derived peptide inhibits the OV2944 migration by downregulating Erk1/2 pathway.
a Top: Representative time-lapse imaging of OV2944 cells expressing tdTomato at time 0 and 2 h later. Bottom: The migration distance of OV2944 cells. The migration activity of OV2944 cells was decreased in the presence of P6, compared with that for nothing complemented (no add), and for P2 (Ctrl). The bar graph shows mean data (mean ± s.e.m., n = 11–30). Circles show individual data. p values represent unpaired Student’s t-test. Scale: 50 μm. b Addition of P6 into the medium suppressed the Erk1/2 activity of OV2944 cells. Top: Following peptide treatment, cell extracts were prepared at the indicated times and a portion of them was subjected to western blot to quantitate the phosphorylation of Erk. Bottom: The relative Erk activity (pErk/total Erk) was plotted as a function of time (n = 8, mean ± s.e.m.). c Representative confocal images of pErk- and actin-staining. Following 30-min treatment either with P6 (P6) or P2 (Ctrl), OV2944 cells were fixed and double-stained with anti-pErk (red) and anti-actin (green) antibodies. The immunoreactive intensities of pErk in the cytosol were quantified (designated as square in a, 10 µm2 per square) and calibrated by the immuno-intensity for actin at the identical square. The ratio of pErk+/actin+ for control was set to 100% and the data were normalized. The graph shows mean data (a.u., optical arbitrary units; Ctrl, n = 94; P6, n = 89; mean ± s.e.m). Circles show individual data. Addition of P6 suppressed pErk immunoreactivity (~65% of control). We also note that the pErk immunoreactivity in the lamellipodia disappeared in the P6-treated cells (arrows). Scale: 10 μm. d Effect of MEK inhibitor treatment on pErk signal. OV2944 cells were treated with MEK inhibitor (PD0325901, 1 µM). After 30-min treatment, cell extracts were prepared and a portion of them was subjected to western blot. The ratio of pErk/tErk for control was set to 100% and the data were normalized. The graph shows mean data (n = 3, mean ± s.e.m.). Circles show individual data. e In vitro invasion assay for MEK inhibitor. OV2944 cells were treated with 1 µM PD0325901 for 15 min, and the invasivity of the cells was evaluated in in vitro invasion assay. The graph shows mean data (n = 8, mean ± s.e.m,). Circles show individual data.
Fig. 4
Fig. 4. Dicalcin-derived peptide interacts with GM1b on the membrane of OV2944 cells.
a Representative confocal images of OV2944 cells treated with P6. OV2944 cells were treated with rhodamine-labeled P6 (Rhod-P6) and anti-CD44 antibody as a marker of the membrane (CD44). Scale: 10 μm. b Representative confocal images of OV2944 cells treated both with P6 and GM1b. OV2944 cells were treated with Rhod-P6 and anti-CD44 antibody, together with GM1b. Scale: 10 μm. c GM1b reduced the fluorescent signal of rhodamine-P6 in OV2944 cells. Fluorescent signals of P6 and CD44 were quantified across the membrane (white line in a and b; n = 20–30, mean ± s.e.m., a.u. optical arbitrary units). Note that the peak signal of CD44 indicates the site of the membrane of OV2944 cells. The signal intensity for P6 at the cell membrane was decreased in the presence of GM1b (P6, +GM1b). d Rhodamine-P6 signals were compared among the indicated conditions of treatments. OV2944 cells were treated with P6 peptide (5 μM) in the presence or absence of GM1b or GT1c at indicated concentrations. GM1b inhibited the binding of P6 to OV2944 cells in a dose-dependent manner, whereas GT1c did not lead to significant changes. The graph shows mean data (n = 18–26, mean ± s.e.m.). p values represent two-sided unpaired Student’s t-test. Circles show individual data. e Representative images of pErk- and actin-staining after 30-min incubation either of GM1b (GM1b) or glucose (Ctrl). OV2944 cells were fixed and double treated with anti-pErk (red) and anti-actin (green) antibodies. Immunoreaction intensities in the cytosol of the cells were quantified (designated as square in a, 10 µm2 per square), calibrated by the actin-intensity at the identical square, and resultant values were analyzed (a.u. optical arbitrary units). The addition of GM1b increased pErk immunoreactivity (150% of control, Ctrl, n = 63; +GM1b, n = 72), indicating GM1b-dependent augmentation of Erk activity within cells. Numbers in the bars represent averaged values in each condition. p values represent two-sided unpaired Student’s t-test. Scale: 10 μm. f Addition of GM1b into the medium augmented the Erk1/2 activity of OV2944 cells. Top: Cell extracts were prepared 30-min after the addition of GM1b into the culture medium and a portion of them was subjected to western blot analysis. Bottom: The ratio of pErk/tErk for control was set to 100% and the data were normalized. The graph shows mean data (n = 4, mean ± s.e.m.). Circles show individual data. Numbers in the bars represent averaged values in each condition. p values represent two-sided unpaired Student’s t-test. g Increased migratory activity by addition of GM1b. OV2944 cells were treated with GM1b (50 μM) for 15 min, and the migratory activity of the cells was evaluated by in vitro invasion assay. The graph shows mean data (n = 21, mean ± s.e.m.). Circles show individual data. p values represent two-sided unpaired Student’s t-test. Numbers in the bars represent averaged values in each condition.

Similar articles

Cited by

References

    1. Miwa N, et al. Dicalcin inhibits fertilization through its binding to a glycoprotein in the egg envelope in Xenopus laevis. J. Biol. Chem. 2010;285:15627–15636. doi: 10.1074/jbc.M109.079483. - DOI - PMC - PubMed
    1. Miwa N, Ogawa M, Hanaue M, Takamatsu K. Fertilization competence of the egg-coating envelope is regulated by direct interaction of dicalcin and gp41, the Xenopus laevis ZP3. Sci. Rep. 2015;5:12672. doi: 10.1038/srep12672. - DOI - PMC - PubMed
    1. Hanaue M, Miwa N. Structural and rheological properties conferring fertilization competence to Xenopus egg-coating envelope. Sci. Rep. 2017;7:5651. doi: 10.1038/s41598-017-06093-3. - DOI - PMC - PubMed
    1. Hanaue M, et al. Characterization of S100A11, a suppressive factor of fertilization, in the mouse female reproductive tract. Mol. Reprod. Dev. 2011;78:91–103. doi: 10.1002/mrd.21273. - DOI - PubMed
    1. Miwa N, Kobayashi M, Takamatsu K, Kawamura S. Purification and molecular cloning of a novel calcium-binding protein, p26olf, in the frog olfactory epithelium. Biochem. Biophys. Res. Commun. 1998;251:860–867. doi: 10.1006/bbrc.1998.9571. - DOI - PubMed

Publication types