

One size does not fit all: an application of stochastic modeling to estimating primary healthcare needs in Ethiopia at the sub-national level
- PMID: 37803351
- PMCID: PMC10559612
- DOI: 10.1186/s12913-023-10061-1
One size does not fit all: an application of stochastic modeling to estimating primary healthcare needs in Ethiopia at the sub-national level
Abstract
Background: Primary healthcare systems require adequate staffing to meet the needs of their local population. Guidelines typically use population ratio targets for healthcare workers, such as Ethiopia's goal of two health extension workers for every five thousand people. However, fixed ratios do not reflect local demographics, fertility rates, disease burden (e.g., malaria endemicity), or trends in these values. Recognizing this, we set out to estimate the clinical workload to meet the primary healthcare needs in Ethiopia by region.
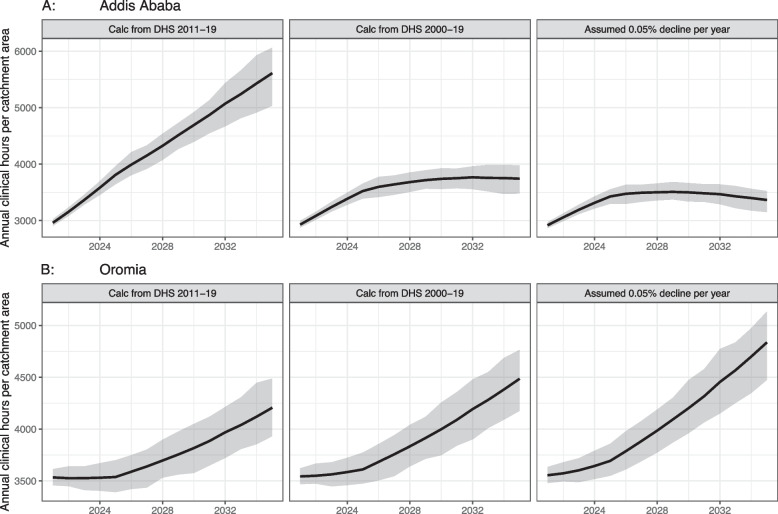
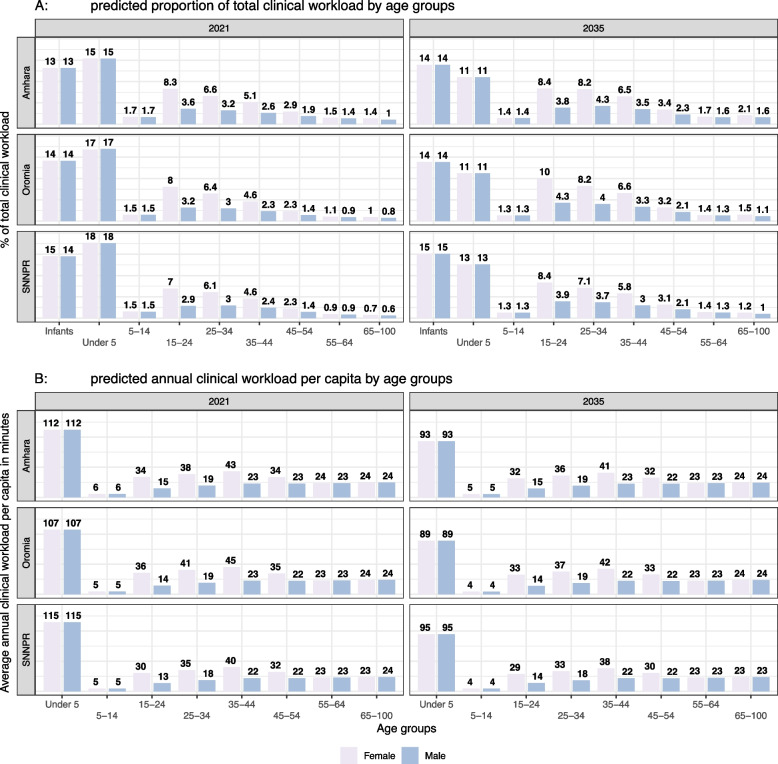
Methods: We utilize the open-source R package PACE-HRH for our analysis, which is a stochastic Monte Carlo simulation model that estimates workload for a specified service package and population. Assumptions and data inputs for region-specific fertility, mortality, disease burden were drawn from literature, DHS, and WorldPop. We project workload until 2035 for seven regions and two charted cities of Ethiopia.
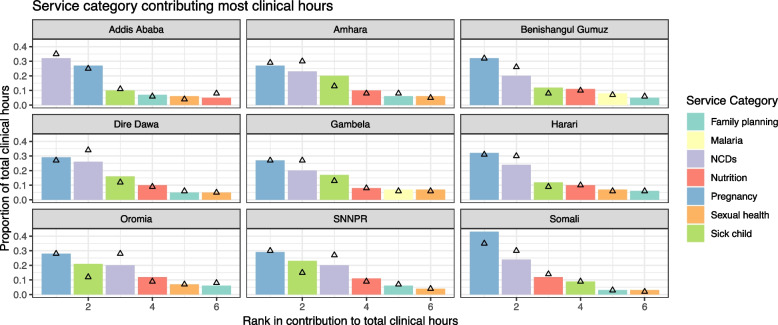
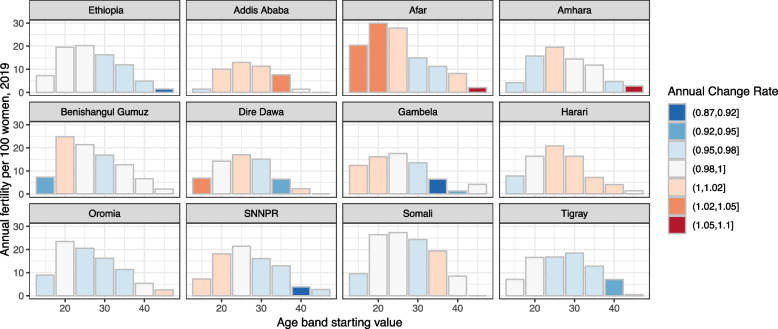
Results: All regions and charted cities are expected to experience increased workload between 2021 and 2035 for a starting catchment of five thousand people. The expected (mean) annual clinical workload varied from 2,930 h (Addis) to 3,752 h (Gambela) and increased by 19-28% over fifteen years. This results from a decline in per capita workload (due to declines in fertility and infectious diseases), overpowered by total population growth. Pregnancy, non-communicable diseases, sick child care, and nutrition remain the largest service categories, but their priority shifts substantially in some regions by 2035. Sensitivity analysis shows that fertility assumptions have major implications for workload. We incorporate seasonality and estimate monthly variation of up to 8.9% (Somali), though most services with high variability are declining.
Conclusions: Regional variation in demographics, fertility, seasonality, and disease trends all affect the workload estimates. This results in differences in expected clinical workload, the level of uncertainty in those estimates, and relative priorities between service categories. By showing these differences, we demonstrate the inadequacy of a fixed population ratio for staffing allocation. Policy-makers and regulators need to consider these factors in designing their healthcare systems, or they risk sub-optimally allocating workforce and creating inequitable access to care.
Keywords: Ethiopia; Human resources for health; Monte Carlo; PACE-HRH; Primary healthcare; Stochastic; Sub-national; Workload.
© 2023. BioMed Central Ltd., part of Springer Nature.
Conflict of interest statement
The authors declare no competing interests.
Figures


Similar articles
-
Learning from Ethiopia's success in reducing maternal and neonatal mortality through a health systems lens.BMJ Glob Health. 2024 May 6;9(Suppl 2):e011911. doi: 10.1136/bmjgh-2023-011911. BMJ Glob Health. 2024. PMID: 38770809 Free PMC article.
-
Trends in contraceptive use and distribution of births with demographic risk factors in Ethiopia: a sub-national analysis.Glob Health Action. 2015 Nov 9;8:29720. doi: 10.3402/gha.v8.29720. eCollection 2015. Glob Health Action. 2015. PMID: 26562138 Free PMC article.
-
The Minderoo-Monaco Commission on Plastics and Human Health.Ann Glob Health. 2023 Mar 21;89(1):23. doi: 10.5334/aogh.4056. eCollection 2023. Ann Glob Health. 2023. PMID: 36969097 Free PMC article. Review.
-
Physical activity, illness and nutritional status among adults in a rural Ethiopian community.Int J Epidemiol. 1995 Oct;24(5):977-83. doi: 10.1093/ije/24.5.977. Int J Epidemiol. 1995. PMID: 8557456
-
Mapping tuberculosis prevalence in Ethiopia using geospatial meta-analysis.Int J Epidemiol. 2023 Aug 2;52(4):1124-1136. doi: 10.1093/ije/dyad052. Int J Epidemiol. 2023. PMID: 37164625 Review.
Cited by
-
Strengthening primary health care in Ethiopia: A scoping review of successes, challenges, and pathways towards universal health coverage using the WHO monitoring framework.PLOS Glob Public Health. 2025 Apr 17;5(4):e0004470. doi: 10.1371/journal.pgph.0004470. eCollection 2025. PLOS Glob Public Health. 2025. PMID: 40244967 Free PMC article.
References
-
- World Health Organization. Everybody’s business — Strengthening health systems to improve health outcomes: WHO’s framework for action. Geneva; 2007. Available from: https://apps.who.int/iris/handle/10665/43918. [cited 2022 Nov 16].
-
- World Health Organization. Monitoring the building blocks of health systems: a handbook of indicators and their measurement strategies. 2010 Available from: https://apps.who.int/iris/bitstream/handle/10665/258734/9789241564052-en.... [cited 2023 Jan 31].
-
- World Health Organization. The world health report 2006: working together for health. 2006; Available from: https://apps.who.int/iris/handle/10665/43432. [cited 2022 Nov 20].
-
- Kingdom of Swaziland Ministry of Health. Human Resources for Health Strategic Plan 2012–2017. 2012 Oct.
-
- The Republic of Rwanda Human Resource for Health Secretariat. 10-Year Government Program: National Strategy for Health Professions Development 2020–2030. Kigali; 2020 Dec.
MeSH terms
LinkOut - more resources
Full Text Sources
Medical
