. 2023 Dec 15;52(6):1057-1070.
doi: 10.1093/ee/nvad077.

Adaptation by death? Cell death-based tolerance to cadmium in 150-generation exposure of Spodoptera exiqua Hübner (Lepidoptera: Noctuidae)

Affiliations

Adaptation by death? Cell death-based tolerance to cadmium in 150-generation exposure of Spodoptera exiqua Hübner (Lepidoptera: Noctuidae)

Agnieszka Babczyńska et al. Environ Entomol. .

Abstract

Mechanisms, including autophagy and apoptosis, which serve to regulate and ensure proper organism functions under optimal conditions, play additional defensive roles under environmental pressure. The aim of this study was to test the following hypotheses: (i) elevated autophagy and apoptosis intensity levels, as defensive processes in response to contact with cadmium, are maintained for a limited number of generations and (ii) the number of generations after which levels of cell death processes reach the reference level depends on selective pressure. Cell death processes were assessed by light and transmission electron microscopy, terminal deoxynucleotidyl transferase dUTP nick end labeling(TUNEL), and cytometric analyses. Model insects (Spodoptera exiqua, Hübner, 1808) were orally exposed to various concentrations of cadmium for 18 generations and compared with reference strains exposed to cadmium or not (control) for over 150 generations. Elevated programmed cell death intensity levels decreased after several generations, indicating tolerance of individuals to cadmium in the diet and verifying the first hypothesis; however, testing the second hypothesis indicated that the number of generations depended not only on pressure intensity, but also on cell death type, since levels of autophagy remained increased for a minimum of 12 generations.

Keywords: apoptosis; autophagy; tolerance.


Figures

Graphical Abstract
Graphical Abstract
Fig. 1.
Fig. 1.
The midgut of V instar larvae of S. exiqua in control specimens. (A) Light microscope. Scale bar = 20 µm. (B) The basal cytoplasm of columnar cells. Scale bar = 5 µm. TEM. (C) The apical cytoplasm of columnar cells. Scale bar = 5 µm. TEM. (D) Regenerative cell among basal regions of columnar cells. Scale bar = 5 µm. TEM. Midgut epithelium (e), columnar cells (dc), goblet cells (gc), midgut lumen (l), microvilli (mv), mitochondria (m), nucleus (n), cortical layer (c), autophagosomes (au), endoplasmic reticulum (ER), glycogen granules (g), reserve material (rm), basal lamina (bl), visceral muscles (vm).
Fig. 2.
Fig. 2.
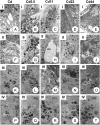
Autophagic structures: autophagosomes (au), autolysosomes (al), residual bodies (rb). in all experimental groups (Cd, Cd5.5, Cd11, Cd22, Cd44) and generations I–IV in the cytoplasm of columnar cells of S. exiqua V instar larvae. Mitochondria (m), endoplasmic reticulum (ER), microvilli (mv), nucleus (n). TEM. (A) Scale bar = 10 µm. (B) Scale bar = 10 µm. (C) Scale bar = 7 µm. (D) Scale bar = 10 µm. (E) Scale bar = 10 µm. (F) Scale bar = 8 µm. (G) Scale bar = 8 µm. (H) Scale bar = 10 µm. (I) Scale bar = 6 µm. (J) Scale bar = 7 µm. (K) Scale bar = 5 µm. (L) Scale bar = 10 µm. (M) Scale bar = 5 µm. (N) Scale bar = 5 µm. (O) Scale bar = 6 µm. (P) Scale bar = 6 µm. (Q) Scale bar = 8 µm. (R) Scale bar = 6 µm. (S) Scale bar = 6 µm. (T) Scale bar = 5 µm.
Fig. 3.
Fig. 3.
Autophagic structures (au) in all experimental groups (Cd, Cd5.5, Cd11, Cd22, Cd44) and generations V–VI, XII, XVIII in the cytoplasm of columnar cells of S. exiqua V instar larvae. Mitochondria (m), endoplasmic reticulum (ER), microvilli (mv), nucleus (n). TEM. (A) Scale bar = 6 µm. (B) Scale bar = 6 µm. (C) Scale bar = 8 µm. (D) Scale bar = 5 µm. (E) Scale bar = 5 µm. (F) Scale bar = 11 µm. (G) Scale bar = 8 µm. (H) Scale bar = 7 µm. (I) Scale bar = 8 µm. (J) Scale bar = 10 µm. (K) Scale bar = 10 µm. (L) Scale bar = 8 µm. (M) Scale bar = 6 µm. (N) Scale bar = 8 µm. (O) Scale bar = 6 µm. (P) Scale bar = 8 µm. (Q) Scale bar = 10 µm. (R) Scale bar = 8 µm. (S) Scale bar = 10 µm. (T) Scale bar = 8 µm.
Fig. 4.
Fig. 4.
Total autophagic cells ratio (%) in midgut cells of V instar S. exigua larvae from I–VI, XII, and XVIII generations of insects from experimental and reference strains. Squares: median values, whiskers: 25–75%. Different letters (a, b, c) denote statistically significant differences between generations (ANOVA, Kruskal–Wallis H test, P < 0.05).
Fig. 5.
Fig. 5.
Total autophagic cells ratio in midgut cells of V instar S. exigua larvae from I–VI, XII, and XVIII generations of insects from experimental and reference strains. Values are expressed as the color scale, where dark shadow is the highest and white – the lowest. Different letters (a, b, c) denote statistically significant differences between strains (ANOVA, Kruskal–Wallis H test, P < 0.05).
Fig. 6.
Fig. 6.
Apoptotic cells (ac) among columnar cells (dc) in the midgut epithelium of different experimental groups and different generations. Mitochondria (m), nucleus (n), microvilli (mv), vacuoles (v). TEM. (A) Cd22, V generation. (B–C) Cd22, III generation. (D) Cd22, VI generation. € Cd11, I generation. (F) Cd, V generation. (G) Cd44, I generation. (H) Necrotic cell with electron-lucent cytoplasm (nc). Cd, V generation. (A) Scale bar = 8 µm, (B) Scale bar = 5 µm, (C) Scale bar = 10 µm, (D) Scale bar = 10 µ€(E) Scale bar = 10 µm, (F) Scale bar = 8 µm, (G) Scale bar = 7 µm, (H) Scale bar = 8 µm.
Fig. 7.
Fig. 7.
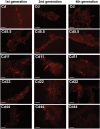
3D representation of the TUNEL assay of the midgut epithelium in S. exiqua larvae in all experimental groups (Cd, Cd5.5, Cd11, Cd22, Cd44). Nuclei of apoptotic cells (red signals). Cross sections. Confocal microscope. Scale bar = 150 µm.
Fig. 8.
Fig. 8.
Total apoptotic cells ratio [%] in midgut cells of V instar S. exigua larvae from I–VI, XII, and XVIII generations of insects from experimental and reference strains. Squares: median values, whiskers: 25–75%. Different letters (a, b, c) denote statistically significant differences between generations (ANOVA, Kruskal–Wallis H test, P < 0.05).
Fig. 9.
Fig. 9.
Total apoptotic cells ratio in midgut cells of V instar S. exigua larvae from I–VI, XII, and XVIII generations of insects from experimental and reference strains. Values are expressed as the color scale, where dark shadow is the highest and white is the lowest. Different letters (a, b, c) denote statistically significant differences between strains (ANOVA, Kruskal–Wallis H test, P < 0.05).

References

    1. Augustyniak M, Babczyńska A, Kozłowski M, Sawczyn T, Augustyniak M.. Effects of zinc and female aging on nymphal life history in a grasshopper from polluted sites. J Insect Physiol. 2008:54(1):41–50. 10.1016/j.jinsphys.2007.08.002. - DOI - PubMed
    1. Augustyniak M, Płachetka-Bożek A, Kafel A, Babczyńska A, Tarnawska M, Janiak A, Loba A, Dziewięcka M, Karpeta-Kaczmarek J, Zawisza-Raszka A.. Phenotypic plasticity, epigenetic or genetic modifications in relation to the duration of Cd-exposure within a microevolution time range in the beet armyworm. PLoS One. 2016:11(12):e0167371. 10.1371/journal.pone.0167371. - DOI - PMC - PubMed
    1. Augustyniak M, Tarnawska M, Dziewięcka M, Kafel A, Rost-Roszkowska M, Babczyńska A.. DNA damage in Spodoptera exigua after multigenerational cadmium exposure – a trade-off between genome stability and adaptation. Sci Total Environ. 2020:745:141048. 10.1016/j.scitotenv.2020.141048. - DOI - PubMed
    1. Babczyńska A, Nowak A, Kafel A, Łozowski B, Rost-Roszkowska M, Tarnawska M, Augustyniak M, Sawadro M, Molenda A.. Autophagy: a necessary defense against extreme cadmium intoxication in a multigenerational 2D experiment. Sci Rep. 2020:10(1):211411. 10.1038/s41598-020-78316-z. - DOI - PMC - PubMed
    1. Babczyńska A, Wilczek G, Szulińska E, Kędziorski A, Franiel I, Migula P.. The reproductive potential of the spiders Agelena labyrinthica and Xerolycosa nemoralis from areas contaminated with metals. Sci Total Environ. 2012:435-436:374–379. 10.1016/j.scitotenv.2012.06.102. - DOI - PubMed

Publication types