

Trends in Cardiovascular Disease Mortality by County-Level Social Vulnerability Index in the United States
- PMID: 37804196
- PMCID: PMC10757513
- DOI: 10.1161/JAHA.123.030290
Trends in Cardiovascular Disease Mortality by County-Level Social Vulnerability Index in the United States
Abstract
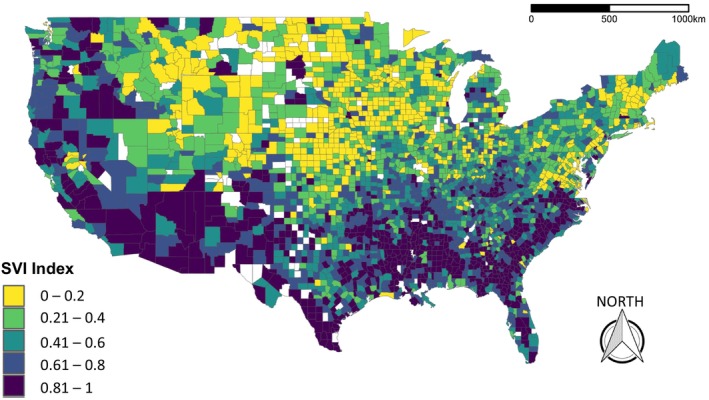
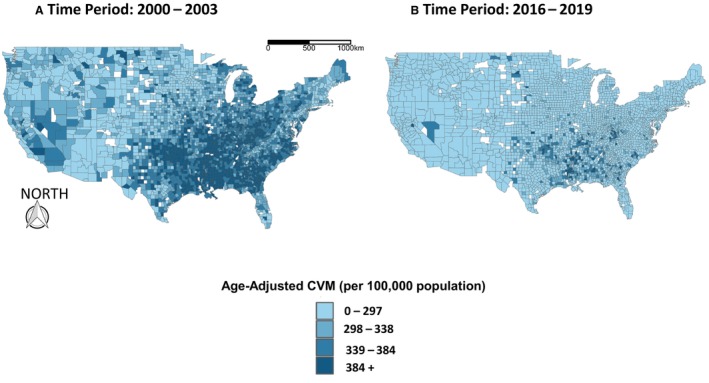
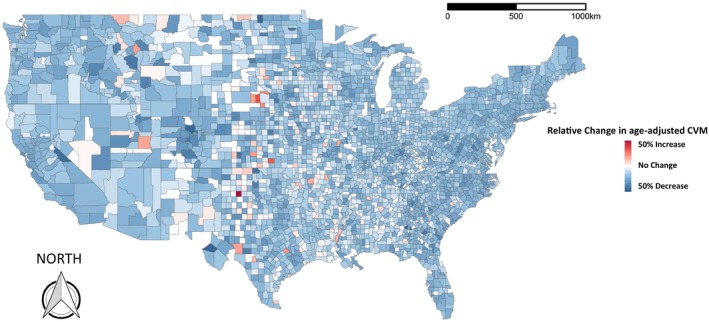
Background Although cardiovascular mortality (CVM) rates in the United States have been declining overall, our study evaluated whether this holds true for areas with increased social deprivation. Methods and Results We used county-level cross-sectional age-adjusted CVM rates (aa-CVM) (2000-2019) linked to the Centers for Disease Control and Prevention Social Vulnerability Index (SVI-2010). We grouped counties as per SVI (Groups I 0-0.2, II 0.21-0.4, III 0.41-0.6, IV 0.61-0.8, and V 0.81-1) and calculated the relative change in the aa-CVM between 2000 to 2003 and 2016 to 2019. We used adjusted linear regression analyses to explore the association between a higher SVI and temporal aa-CVM improvement; we studied this temporal change in aa-CVM across subgroups of race, sex, and location. The median aa-CVM rate (per 100 000) was 272.6 (interquartile range [IQR]: 237.5-311.7). The aa-CVM was higher in men (315.6 [IQR: 273.4-363.9]) than women (221.3 [IQR: 189.6-256.7]), and in Black residents (347.2 [IQR: 301.1-391.1]; P<0.001) than White residents (258.9 [IQR: 226-299.1]; P<0.001). The aa-CVM for SVI I (233.6 [IQR: 214.8-257.0]) was significantly lower than that of group V (323.6 [IQR: 277.2-359.2]; P<0.001). The relative reduction in CVM was significantly higher for SVI group I (32.2% [IQR: 24.2-38.4]) than group V (27.2% [IQR: 19-34.1]) counties. After multivariable adjustment, a higher SVI index was associated with lower relative improvement in the age-adjusted CVM (model coefficient -3.11 [95% CI, -5.66 to -1.22]; P<0.001). Conclusions Socially deprived counties in the United States had higher aa-CVM rates, and the improvement in aa-CVM over the past 20 years was lower in these counties.
Keywords: cardiovascular mortality; social determinants of health; social vulnerability.
Figures
Similar articles
-
Social Vulnerability and Premature Cardiovascular Mortality Among US Counties, 2014 to 2018.Circulation. 2021 Oct 19;144(16):1272-1279. doi: 10.1161/CIRCULATIONAHA.121.054516. Epub 2021 Oct 18. Circulation. 2021. PMID: 34662161
-
Geographically Weighted Modeling to Explore Social and Environmental Factors Affecting County-Level Cardiovascular Mortality in People With Diabetes in the United States: A Cross-Sectional Analysis.Am J Cardiol. 2023 Dec 15;209:193-198. doi: 10.1016/j.amjcard.2023.09.084. Epub 2023 Oct 18. Am J Cardiol. 2023. PMID: 37865123 Free PMC article.
-
Social Vulnerability and Sickle Cell Disease Mortality in the US.JAMA Netw Open. 2024 Sep 3;7(9):e2440599. doi: 10.1001/jamanetworkopen.2024.40599. JAMA Netw Open. 2024. PMID: 39348116 Free PMC article.
-
Social Vulnerability and Location of Death in Heart Failure in the United States.Curr Probl Cardiol. 2023 Jul;48(7):101689. doi: 10.1016/j.cpcardiol.2023.101689. Epub 2023 Mar 10. Curr Probl Cardiol. 2023. PMID: 36906162 Review.
-
Social Vulnerability Index and Health Outcomes in the United States: A Systematic Review.Fam Community Health. 2025 Apr-Jun 01;48(2):81-96. doi: 10.1097/FCH.0000000000000421. Epub 2025 Jan 14. Fam Community Health. 2025. PMID: 39807786
Cited by
-
Implementing a pharmacogenomic-driven algorithm to guide antiplatelet therapy among Caribbean Hispanics: a non-randomised clinical trial.BMJ Open. 2024 Sep 5;14(9):e084119. doi: 10.1136/bmjopen-2024-084119. BMJ Open. 2024. PMID: 39242160 Free PMC article. Clinical Trial.
-
Chinese herbal medicine may reduce major adverse cardiovascular events in patients with dialysis hypotension: A taiwan nationwide cohort study.J Tradit Complement Med. 2024 Mar 6;14(5):550-557. doi: 10.1016/j.jtcme.2024.03.009. eCollection 2024 Sep. J Tradit Complement Med. 2024. PMID: 39262661 Free PMC article.
-
The association between county-level social determinants of health and cardio-kidney-metabolic disease attributed all-cause mortality in the US: A cross sectional analysis.Am J Med Sci. 2025 Apr;369(4):491-497. doi: 10.1016/j.amjms.2025.01.007. Epub 2025 Jan 21. Am J Med Sci. 2025. PMID: 39848403 Free PMC article.
-
The association between county-level premature cardiovascular mortality related to cardio-kidney-metabolic disease and the social determinants of health in the US.Sci Rep. 2024 Oct 23;14(1):24984. doi: 10.1038/s41598-024-73974-9. Sci Rep. 2024. PMID: 39443546 Free PMC article.
-
Social and Environmental Determinants of Health and Cardio-Kidney-Metabolic Syndrome-Related Mortality.JAMA Netw Open. 2024 Sep 3;7(9):e2435783. doi: 10.1001/jamanetworkopen.2024.35783. JAMA Netw Open. 2024. PMID: 39325449 Free PMC article.
References
-
- Heart disease facts . Accessed February 24, 2023. https://www.cdc.gov/heartdisease/facts.htm
-
- 2013 ACC/AHA guideline on the assessment of cardiovascular risk: a report of the American College of Cardiology/American Heart Association Task Force on Practice Guidelines. Accessed September 1, 2022. https://pubmed.ncbi.nlm.nih.gov/24222018/
Publication types
MeSH terms
Grants and funding
LinkOut - more resources
Full Text Sources
Miscellaneous
