. 2023 Nov 27;33(23):11300-11319.
doi: 10.1093/cercor/bhad367.

Cortical origin of theta error signals

Affiliations

Cortical origin of theta error signals

Beatriz Herrera et al. Cereb Cortex. .

Abstract

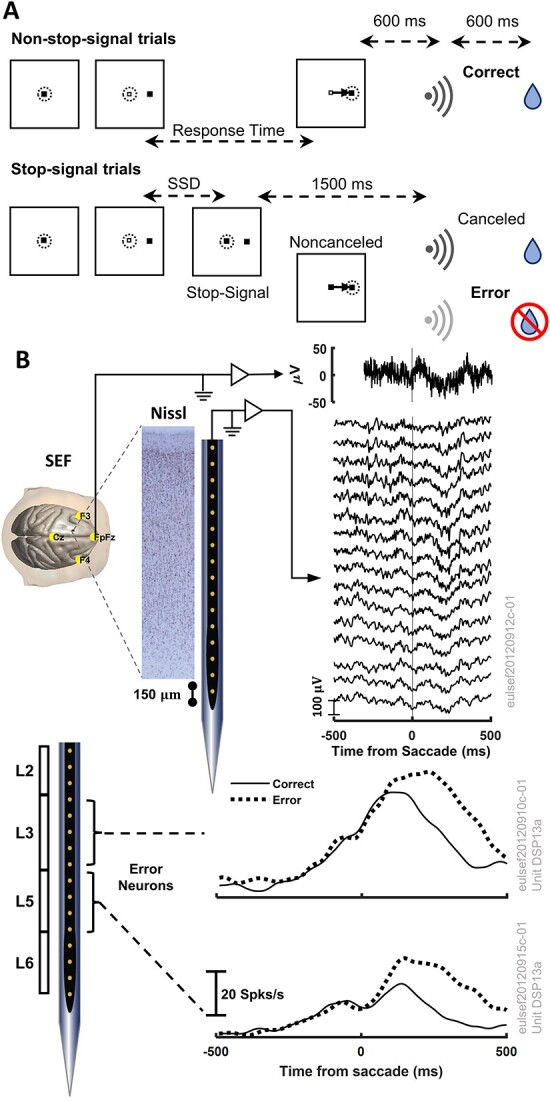
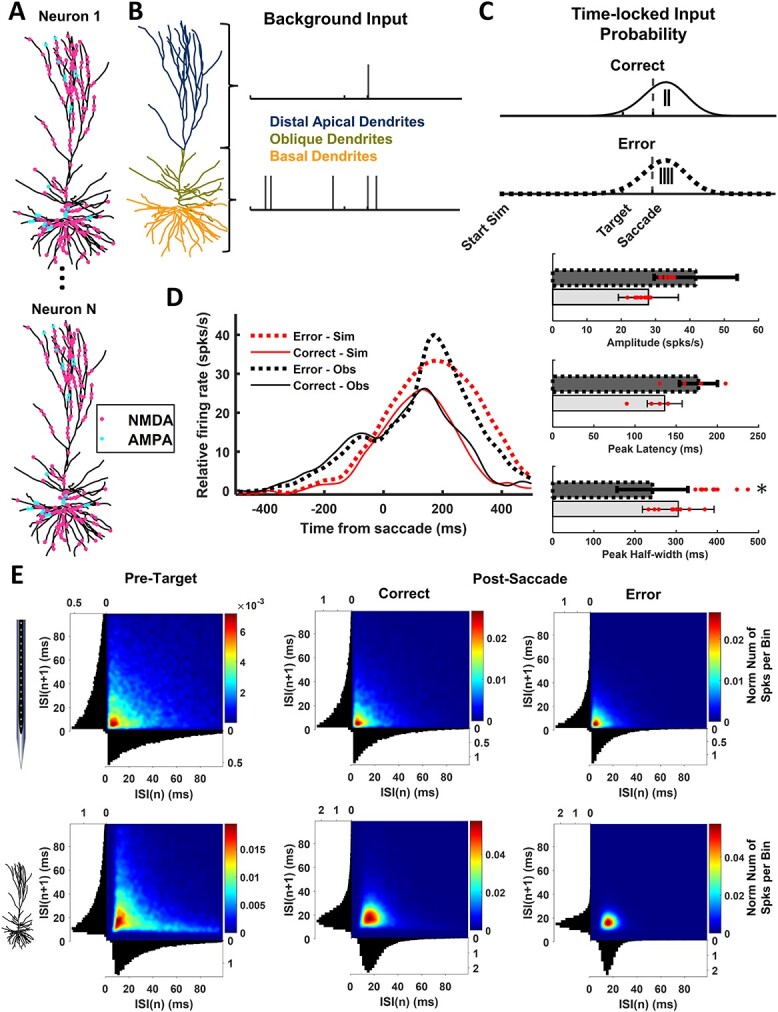
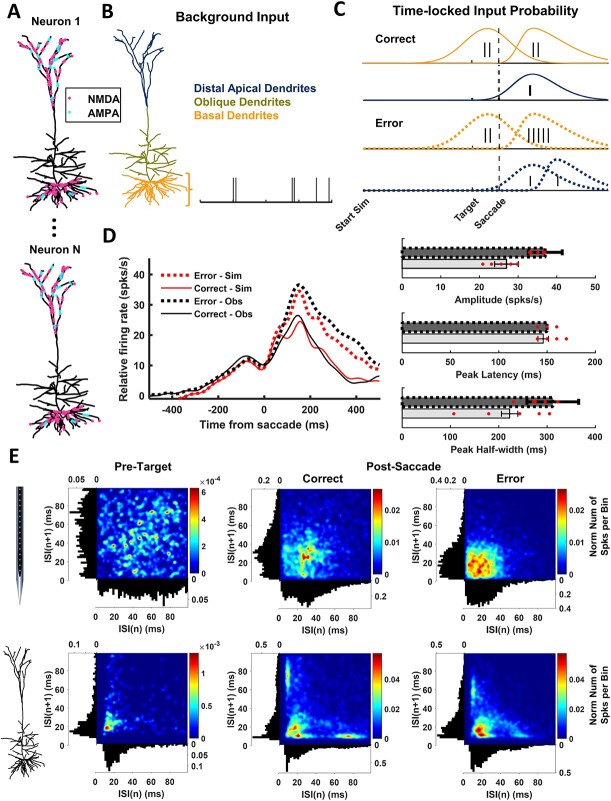
A multi-scale approach elucidated the origin of the error-related-negativity (ERN), with its associated theta-rhythm, and the post-error-positivity (Pe) in macaque supplementary eye field (SEF). Using biophysical modeling, synaptic inputs to a subpopulation of layer-3 (L3) and layer-5 (L5) pyramidal cells (PCs) were optimized to reproduce error-related spiking modulation and inter-spike intervals. The intrinsic dynamics of dendrites in L5 but not L3 error PCs generate theta rhythmicity with random phases. Saccades synchronized the phases of the theta-rhythm, which was magnified on errors. Contributions from error PCs to the laminar current source density (CSD) observed in SEF were negligible and could not explain the observed association between error-related spiking modulation in L3 PCs and scalp-EEG. CSD from recorded laminar field potentials in SEF was comprised of multipolar components, with monopoles indicating strong electro-diffusion, dendritic/axonal electrotonic current leakage outside SEF, or violations of the model assumptions. Our results also demonstrate the involvement of secondary cortical regions, in addition to SEF, particularly for the later Pe component. The dipolar component from the observed CSD paralleled the ERN dynamics, while the quadrupolar component paralleled the Pe. These results provide the most advanced explanation to date of the cellular mechanisms generating the ERN.

Keywords: CSD; ERN; biophysical models; multiscale analysis; theta rhythm.


Figures

Fig. 1
Fig. 1
Experimental procedures and methodology. A. Stop-signal saccade countermanding task. All trials started with the presentation of a square fixation marker. Monkeys were required to hold fixation for a variable interval after which the center of the square was extinguished simultaneously with the presentation of a peripheral target on the right or left. On no-stop-signal trials, monkeys shifted their gaze to the target, whereupon after 600 ± 0 ms a high-pitched tone was delivered followed 600 ± 0 ms later by fluid reward. On stop-signal trials, a variable SSD after target presentation the center of the fixation spot was re-illuminated instructing the monkey to inhibit the planned saccade. If monkeys canceled the saccade, the high-pitch tone was presented after 1500 ± 0 followed 600 ± 0 ms later by fluid reward. SSD was adjusted such that monkeys successfully canceled the saccade in ~ 50% of the trials. If monkeys produced a noncanceled error, a low-pitch tone was presented 600 ± 0 ms after the saccade and no fluid reward was delivered. B. Schematic of concurrent EEG and LFP recording in SEF used to calculate theta power and CSD after saccades (top) and mean spike rate of representative L3 and L5 putative error PCs (bottom).
Fig. 2
Fig. 2
Simulation of L3 error PCs optimized to replicate observed discharge rates and ISIs. A. Representative randomized locations of NMDA and AMPA synapses on simulated L3 PC (ModelDB, accession #238347, 2013_03_06_cell03_789_H41_03, active model cell0603_08_model_602). B. Observed baseline spiking statistics were replicated by activating NMDA and AMPA synapses located on the distal apical, basal, and oblique dendrites. The timing of pre-synaptic inputs was drawn from Poisson distributions with a mean of 2 for basal and oblique dendritic synapses and a mean of 3.5 for distal apical synapses. C. Spiking statistics after saccade initiation were simulated by activating distal apical and basal synapses with spike times drawn from a left-skewed normal probability distribution (skewness = −1). To replicate observed post-saccadic error-related modulation, for correct trials 2 spikes were drawn from a distribution with a mean of 216.6 ms and a standard deviation of 141.6 ms, and for error trials 4 spikes, from a distribution with a mean of 298.6 ms and a standard deviation of 178.6 ms. The vertical lines indicate the total number of pre-synaptic spikes that each synapse will receive under its associated probability distribution. D. Observed (black) and simulated (red) mean spike rate for correct (thin solid) and error (thick dotted) trials (left) with comparisons of observed (bars) and simulated (dots) peak amplitude, peak latency, and peak half-width (right). Based on non-parametric permutation tests the simulated values were not different from observed amplitude (correct trials, P = 0.5107; error, P = 0.0654), peak latency (correct, P = 0.2449; error, P = 0.5449), and peak half width for correct (P = 0.1083) but not error trials (P = 0.00036). E. Observed (top) and simulated (bottom) ISIn + 1 versus ISIn with heatmap indicating the normalized number of spikes count per bin and marginal distributions before target presentation (left) and after correct (middle) and error (right) saccades. Simulated ISI produced the observed bursting pattern of successive ISI.
Fig. 3
Fig. 3
Simulation of L5 error PCs optimized to replicate observed discharge rates and ISIs. Conventions as in Fig. 2. A. Representative randomized locations of NMDA and AMPA synapses on simulated L5 PC (ModelDB, accession #139653, “cell #1”). B. Observed baseline spiking statistics were replicated by activating NMDA and AMPA synapses on the basal dendrites with input times drawn from Poisson distributions with a mean of 2. C. Spiking statistics before all saccades were simulated by activating basal synapses with 2 pre-synaptic spike times drawn from a normal distribution (σ = 140 ms) centered 70 ms before saccade initiation. Spiking statistics after correct saccades were simulated with inputs to distal apical dendrites drawn from a right-skewed normal distribution (skewness = 2, σ = 200 ms) centered 100 ms after the saccade plus a basal dendritic input drawn from a right-skewed normal distribution (skewness = 5, σ = 250 ms) centered 120 ms after the saccade. Spiking statistics after error saccades were simulated by distal apical inputs with the same probability distribution as in correct trials plus a basal input at 120 ms with the same probability distribution as in correct trials sufficient to yield 5 pre-synaptic spikes and a second distal apical input drawn from a right-skewed normal distribution (skewness = 5, σ = 250 ms) centered 280 ms after the saccade. D. Simulated values were not different from observed amplitude (correct trials, P = 0.4841; error, P = 0.4188), peak latency (correct, P = 0.3783; error, P = 1.0000), and peak half width (correct, P = 0.1553; error, P = 0.3669). E. Simulated ISI produced the observed shorter ISI during error trials.
Fig. 4
Fig. 4
EEG and LFP θ power. The top row illustrates the average ERP obtained from electrode FpFz aligned on saccade on correct (left) and error (middle) trials with the resulting difference wave (right). The spike potential associated with saccade production is evident in the correct and error plots. The difference wave highlights the ERN followed by the Pe component. The next rows plot observed (middle) and simulated (bottom) average θ power across sessions through time across the cortical layers on correct and error trials with the time-depth difference. Colormap plots power modulation relative to the mean power during 200 ms before target presentation (μV2) for observed and simulated power. The time of peak polarization of ERN (dash) and Pe (dot–dash) are indicated. Statistically significant regions are outlined in the difference plot.
Fig. 5
Fig. 5
Observed (top) and simulated (bottom) average LFP and CSD. Simulated LFPs were evoked by the activity of 625 L3 and 1,000 L5 error PCs located in a cylindrical cortical column of 3 mm diameter and multiplied by a factor of 27.48 to account for the actual number of error PCs in SEF (see “Materials and Methods”—Analysis of simulated field potentials). Neither observed nor simulated CSD had a simple bipolar structure, but the simulated CSD did not replicate the observed CSD.
Fig. 6
Fig. 6
Intrinsic rhythmicity of 100 simulated L3 (A) and L5 (B) error neurons with randomized distributions of AMPA (cyan) and NMDA (pink) synapses (left) activated randomly according to Poisson processes (L3: Basal mean = 2; apical mean = 1; L5: Basal mean = 5, oblique mean = 4, apical mean = 1) without (left) and with (right) a synchronized input at time zero. The mean power spectra (formula image) of somatic (salmon) and dendritic (light blue) membrane potentials (first row) illustrate the consistency of simulated neurons and pronounced peak in θ power in L5 but not L3 PCs. θ phase of the dendritic (second row) and somatic (third row) membrane potentials illustrate phase resetting of dendritic and soma membrane potentials of L5 neurons but only the dendritic potentials of L3 neurons. To quantify the laminar structure of θ power, the somas of the simulated neurons were randomly distributed within a cylindrical cortical column of 3 mm diameter with random depths within their associated cortical layers (L3 700–1,100 μm below the pia matter; L5 1,125–1,750 μm). The laminar distribution of LFP θ power (bottom row) demonstrates elevated θ power derived only from L5 PCs synchronized on the phase resetting.
Fig. 7
Fig. 7
Multipole moments derived from observed (left) and simulated (right) CSD. A. Left—volume conductor model of the monkey’s head (BEM) with surfaces color-coded and electrodes represented by yellow discs. Surfaces for constructing the BEM model of the monkey’s head were obtained from the NIMH macaque template version 2.0 (Jung et al. 2021). Right—location of the SEF current sources used in the EEG forward model. B-C. The time course of the monopole (mz, top), dipole (dz, middle), and quadrupole (qz, bottom) moments are plotted for correct (thin solid) and error (thick dotted) trials and their difference (magenta, thick solid). The time of peak polarization of ERN (dash) and Pe (dot–dash) are indicated. The unbalanced current observed across depths creates the monopole moment. The simulated dipolar and quadrupolar moments were 3 orders of magnitude weaker than the observed. Scaling up multipoles by increasing the density of error PCs was not enough to reproduce the temporal profiles of these LFP and scalp potentials.
Fig. 8
Fig. 8
Contributions of SEF to the ERN and Pe.. A. Cranial EEG during correct (thin solid) and error (thick dotted) trials with their difference (bottom panel) illustrating the ERN and Pe components. B. Comparison of the difference waves of the observed EEG (black, left axis) with the predicted EEG monopolar (top), dipolar (middle), and quadrupolar (bottom) components (red, right axis), respectively. The predicted EEG dipolar component explained ERN features and the quadrupolar component reproduced those for the Pe. The presence of a monopole might indicate strong electro-diffusion, dendritic/axonal electrotonic current leakage outside SEF, or violations of the model assumptions (see Discussion). C. Comparison of EEG observed (black) and predicted (red) from the multipolar moments derived from the CSD in SEF for correct (top) and error (middle) trials, respectively. The amplitude of the EEG signals was normalized by the maximum absolute EEG amplitude across trial types for Eu EEG and Eu CSD EEG separately. D. Variation of peak polarization of predicted ERN (left) and Pe (right) as a function of the diameter of the cortical column used in the CSD calculation. Linear regressions illustrate the significant variation, which was stronger for the Pe than the ERN.

References

    1. Armstrong IT, Munoz DP. Inhibitory control of eye movements during oculomotor countermanding in adults with attention-deficit hyperactivity disorder. Exp Brain Res. 2003:152(4):444–452. - PubMed
    1. Aron AR, Fletcher PC, Bullmore ET, Sahakian BJ, Robbins TW. Stop-signal inhibition disrupted by damage to right inferior frontal gyrus in humans. Nat Neurosci. 2003:6(2):115–116. - PubMed
    1. Bédard C, Destexhe A. Macroscopic models of local field potentials and the apparent 1/f noise in brain activity. Biophys J. 2009:96(7):2589–2603. - PMC - PubMed
    1. Beul SF, Hilgetag CC. Towards a “canonical” agranular cortical microcircuit. Front Neuroanat. 2015:8:1–8. - PMC - PubMed
    1. Billeh YN, Cai B, Gratiy SL, Dai K, Iyer R, Gouwens NW, Abbasi-Asl R, Jia X, Siegle JH, Olsen SR, et al. Systematic integration of structural and functional data into multi-scale models of mouse primary visual cortex. Neuron. 2020:106:388–403.e18. - PubMed

Publication types

LinkOut - more resources