. 2024 Mar 1;147(3):1043-1056.
doi: 10.1093/brain/awad340.

Sustained OMA1-mediated integrated stress response is beneficial for spastic ataxia type 5

Affiliations

Sustained OMA1-mediated integrated stress response is beneficial for spastic ataxia type 5

Camilla Aurora Franchino et al. Brain. .

Abstract

AFG3L2 is a mitochondrial protease exerting protein quality control in the inner mitochondrial membrane. Heterozygous AFG3L2 mutations cause spinocerebellar ataxia type 28 (SCA28) or dominant optic atrophy type 12 (DOA12), while biallelic AFG3L2 mutations result in the rare and severe spastic ataxia type 5 (SPAX5). The clinical spectrum of SPAX5 includes childhood-onset cerebellar ataxia, spasticity, dystonia and myoclonic epilepsy. We previously reported that the absence or mutation of AFG3L2 leads to the accumulation of mitochondria-encoded proteins, causing the overactivation of the stress-sensitive protease OMA1, which over-processes OPA1, leading to mitochondrial fragmentation. Recently, OMA1 has been identified as the pivotal player communicating mitochondrial stress to the cytosol via a pathway involving the inner mitochondrial membrane protein DELE1 and the cytosolic kinase HRI, thus eliciting the integrated stress response. In general, the integrated stress response reduces global protein synthesis and drives the expression of cytoprotective genes that allow cells to endure proteotoxic stress. However, the relevance of the OMA1-DELE1-HRI axis in vivo, and especially in a human CNS disease context, has been poorly documented thus far. In this work, we demonstrated that mitochondrial proteotoxicity in the absence/mutation of AFG3L2 activates the OMA1-DELE1-HRI pathway eliciting the integrated stress response. We found enhanced OMA1-dependent processing of DELE1 upon depletion of AFG3L2. Also, in both skin fibroblasts from SPAX5 patients (including a novel case) and in the cerebellum of Afg3l2-/- mice we detected increased phosphorylation of the α-subunit of the eukaryotic translation initiation factor 2 (eIF2α), increased levels of ATF4 and strong upregulation of its downstream targets (Chop, Chac1, Ppp1r15a and Ffg21). Silencing of DELE1 or HRI in SPAX5 fibroblasts (where OMA1 is overactivated at basal state) reduces eIF2α phosphorylation and affects cell growth. In agreement, pharmacological potentiation of integrated stress response via Sephin-1, a drug that selectively inhibits the stress-induced eIF2alpha phosphatase GADD34 (encoded by Ppp1r15a), improved cell growth of SPAX5 fibroblasts and cell survival and dendritic arborization ex vivo in primary Afg3l2-/- Purkinje neurons. Notably, Sephin-1 treatment in vivo extended the lifespan of Afg3l2-/- mice, improved Purkinje neuron morphology, mitochondrial ultrastructure and respiratory capacity. These data indicate that activation of the OMA1-DELE1-HRI pathway is protective in the context of SPAX5. Pharmacological tuning of the integrated stress response may represent a future therapeutic strategy for SPAX5 and other cerebellar ataxias caused by impaired mitochondrial proteostasis.

Keywords: OMA1; integrated stress response; spastic ataxia type 5.


Conflict of interest statement

The authors report no competing interests.

Figures

Figure 1
Figure 1
OMA1 induces the activation of ISR in vivo in Afg3l2−/− mice cerebellum. (A) Western blot analysis performed on Afg3l2+/+ and Afg3l2−/− cerebellar lysates collected from mice at postnatal Day 14, showing levels of OMA1 and OPA1, with relative quantification. Calnexin was used to verify equal loading. Bars represent means ± standard error of the mean (SEM); n ≥ 4 mice. Unpaired Student's t-test: *P < 0.05, ***P < 0.001, ****P < 0.0001. CRB = cerebellum. (B) Schematic representation of the stress cascade downstream OMA1 activation. Created with BioRender.com. (C) Western blot analysis performed on Afg3l2+/+ and Afg3l2−/− cerebellar lysates collected from mice at postnatal Day 14, showing levels of P-eIF2α and TOT-eIF2α, with relative quantification. CKAP4 was used to verify equal loading. Bars represent means ± SEM, n ≥ 6 mice. Unpaired Student's t-test with Welch correction: **P < 0.01, ns = not significant. (D) qRT-PCR showing the expression of Atf4, Chop, Chac1, Ppp1r15a, Herpud1, Eif2s2 and Fgf21 in cerebellum of Afg3l2+/+ and Afg3l2−/− mice at postnatal Day 14. Expression levels were normalized to the housekeeping gene Hprt1. Bars represent means ± SEM, n ≥ 4 mice. Unpaired Student's t-test with Welch correction: *P < 0.05; **P < 0.01; ***P < 0.001; ****P < 0.0001. (E) Western blot analysis performed on Afg3l2+/+ and Afg3l2−/− cerebellar lysates collected from mice at postnatal Day 1, showing levels of P-eIF2α and TOT-eIF2α, with relative quantification. CKAP4 was used to verify equal loading. Bars represent means ± SEM, n = 3 mice. Unpaired Student's t-test, ns = not significant. (F) qRT-PCR showing the expression of Atf4, Chop and Fgf21 in cerebellum of Afg3l2+/+ and Afg3l2−/− mice at postnatal Day 1. Expression levels were normalized to the housekeeping gene Hprt1. Bars represent means ± SEM, n ≥ 5 mice. Unpaired Student's t-test, ns = not significant. ISR = integrated stress response.
Figure 2
Figure 2
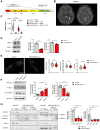
Activation of OMA1-mediated ISR in SPAX5 patient fibroblasts. (A) AFG3L2 protein scheme with functional domains, reporting the mutations described here. (B) Brain MRI scan of Patient 2: MRI T2-weighted, axial view, performed at age 3 years, showing symmetric hypersignal intensity in both globi pallidi (white arrow) and in the pyramidal tract at the midbrain level (double white arrow) as well as volume loss in both globi pallidi. (C) Analysis of ΔΨm by live-imaging measurement of TMRM fluorescence intensity in SPAX5-Patient 2 primary fibroblasts. Bars represent mean ± standard error of the mean (SEM), n = 300 cells from three independent experiments. Two-way ANOVA with Tukey correction: ****P < 0.0001. (D) Western blot analysis performed on cell lysates obtained from SPAX5-Patient 2 primary fibroblasts and controls, showing levels of OMA1 and OPA1, with relative quantification. Calnexin was used to verify equal loading. Bars represent means ± SEM of three independent experiments. Unpaired Student's t-test: *P < 0.05; ***P < 0.001. (E) Representative images of SPAX5-Patient 2 and relative control human primary fibroblasts, infected with mtDsRed2, and relative quantification of major axis, average size and circularity index. Bars represent means ± SEM of 300 cells from three independent experiments. Unpaired Student's t-test: *P < 0.05; **P < 0.01. (F) Representative western blot analysis performed on cell lysates obtained from SPAX5-Patient 1 and Patient 2 primary fibroblasts and controls, showing levels of AFG3L2, P-eIF2α and TOT-eIF2α, with relative quantification. Calnexin was used to verify equal loading. Bars represent mean ± SEM of at least three independent experiments (we employed four different age-matched control human primary fibroblasts). One-way ANOVA with Tukey correction: *P < 0.05; ***P < 0.001; ****P < 0.0001. (G) Western blot analysis performed on three different AFG3L2 knockdown HEK 293 T clones and wild-type controls upon overexpression of DELE1-HA and relative quantification of S-DELE1 on L-DELE1 and OMA1. GAPDH was used to verify equal loading. Asterisks highlight aspecific bands. Bars represent means ± SEM of three independent experiments. One-way ANOVA with Tukey correction: **P < 0.01; ***P < 0.001; ****P < 0.0001.
Figure 3
Figure 3
ISR modulation in SPAX5-Patient 2 fibroblasts. (A) qRT-PCR on control human primary fibroblasts silenced with siRNAs for DELE1 at 120 pmol. Bars represent means ± standard error of the mean (SEM) of three independent experiments. Unpaired Student's t-test: **P < 0.01. (B) Cell growth rate analysis of SPAX5-Patient 2 and control human primary fibroblasts, cultured in low glucose (LG), silenced with siRNA for DELE1 or not specific siRNA (Scramble). Bars represent means ± SEM of eight independent experiments. Two-way ANOVA with Tukey correction: *P < 0.05; ****P < 0.0001. (C) Western blot analysis performed on cell lysates obtained from counted SPAX5-Patient 2 primary fibroblasts and control human primary fibroblasts with or without siRNA for DELE1, showing levels of P-eIF2α, TOT-eIF2α and ATF4, with relative quantification. CKAP4 was used to verify equal loading. Bars represent means ± SEM of three independent experiments. Two-way ANOVA with Tukey correction: *P < 0.05; **P < 0.01. (D) qRT-PCR on control human primary fibroblasts silenced with siRNAs for HRI at 60 pmol. Bars represent means ± SEM of three independent experiments. Unpaired Student's t-test: **P < 0.01. (E) Cell growth rate analysis of SPAX5-Patient 2 and control human primary fibroblasts, cultured in low glucose conditions, silenced with siRNA for HRI or not specific siRNA (Scramble). Bars represent means ± SEM of four independent experiments. Two-way ANOVA with Tukey correction: *P < 0.05; ****P < 0.0001. (F) Representative western blot analysis performed on cell lysates obtained from counted SPAX5-Patient 2 primary fibroblasts with or without siRNA for HRI, showing levels of P-eIF2α. CKAP4 was used to verify equal loading. Bars represent means ± SEM of three independent experiments. Unpaired Student's t-test: *P < 0.05. ISR = integrated stress response.
Figure 4
Figure 4
Sephin-1 treatment improves SPAX5-Patient 2 primary fibroblasts viability and number and arborization of primary Purkinje neurons derived from Afg3l2−/− mice cerebellum. (A) Cell growth rate analysis of SPAX5-Patient 2 primary fibroblasts and control human primary fibroblasts, cultured in low glucose conditions (LG), treated with Sephin-1 25 µM for 24 h. Bars represent means ± standard error of the mean (SEM) of 10 independent experiments. Two-way ANOVA with Tukey correction: *P < 0.05; ****P < 0.0001. NT = not treated. (B) Western blot analysis performed on SPAX5-Patient 2 and control human primary fibroblasts treated with Sephin-1 25 µM for 24, 48 and 72 h. Calnexin was used to verify equal loading. Two-way ANOVA with Tukey correction: *P < 0.05; **P < 0.01; ***P < 0.001. NT = not treated. (C) Analysis of ΔΨm by live-imaging measurement of TMRM fluorescence intensity in SPAX5-Patient 2 primary fibroblasts upon treatment with Sephin-1 at 25 µM for 24 h. Bars represent mean ± SEM; n = 300 cells from three independent experiments. One-way ANOVA with Tukey correction: ***P < 0.001; ****P < 0.0001. (D) Representative images of primary Purkinje neurons at DIV14, derived from Afg3l2+/+ and Afg3l2−/− mouse cerebellum, treated with DMSO or Sephin-1 100 nM every 48 h. (E) Average number of Purkinje neurons per well in at least five independent dissections and quantification of the dendritic arborization (at least 22 cells analysed per genotype per condition). Bars represent means ± SEM. Two-way ANOVA with Tukey correction: *P < 0.05; **P < 0.01; ****P < 0.0001.
Figure 5
Figure 5
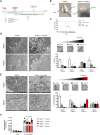
Sephin-1 treatment improves Purkinje neuron morphology and mitochondrial ultrastructural defects in Afg3l2−/− mice cerebellum. (A) Schematic representation of Sephin-1 treatment in vivo. (B) Representative images of Afg3l2+/+ mice and Afg3l2−/− mice treated with vehicle or Sephin-1 at postnatal Day 14. (C) Kaplan-Meier survival curve of Afg3l2+/+ mice and Afg3l2−/− mice treated with either vehicle or Sephin-1 at 8 mg/kg. Log-rank (Mantel-Cox) test: ****P < 0.0001. (D) Representative images of semithin sections from Afg3l2+/+ and Afg3l2−/− mice cerebellum at postnatal Day 14, treated with either vehicle or Sephin-1 at 8 mg/kg, and relative quantification of the morphology classified in three classes. Bars represent means ± standard error of the mean (SEM) of at least 60 Purkinje neurons per mouse (n = 3 mice per condition). Chi-square test (two degrees of freedom): Afg3l2+/+ vehicle versus Afg3l2+/+ Sephin-1 *P < 0.05; Afg3l2+/+ vehicle versus Afg3l2−/− vehicle or Afg3l2−/− Sephin-1 ***P < 0.001; Afg3l2−/− vehicle versus Afg3l2−/− Sephin-1 ***P < 0.001. (E) Representative images of ultrathin section of Afg3l2+/+ and Afg3l2−/− mice cerebellar slices at postnatal Day 14, treated with either vehicle or Sephin-1 at 8 mg/kg, and relative quantification of the morphology classified in four classes. Bars represent means ± SEM of at least 70 mitochondria for each mouse (n = 3 mice). Chi-square test (three degrees of freedom): Afg3l2+/+ vehicle versus Afg3l2+/+ Sephin-1 **P < 0.01; Afg3l2+/+ vehicle versus Afg3l2−/− vehicle or Afg3l2−/− Sephin-1 ***P < 0.001, Afg3l2−/− vehicle versus Afg3l2−/− Sephin-1 ***P < 0.001. (F) ATP production analysis in freshly isolated mitochondria from mouse cerebellum at 14 days of age, at basal level and upon pyruvate/malate stimulation. Bars represent mean ± SEM (n = 7 mice per condition). Two-way ANOVA with Tukey correction: *P < 0.05; **P < 0.01.
Figure 6
Figure 6
Model. Schematic representation of the physiological and pathological conditions downstream OMA1 activation and targeted approaches. Created with BioRender.com.

References

    1. Quiros PM, Langer T, Lopez-Otin C. New roles for mitochondrial proteases in health, ageing and disease. Nat Rev Mol Cell Biol. 2015;16:345–359. - PubMed
    1. Brussino A, Brusco A, Durr A, et al. Spinocerebellar ataxia type 28. In: Pagon RA, Adam MP, Ardinger HH, eds. GeneReviews®. University of Washington, Seattle; 1993. - PubMed
    1. Pierson TM, Adams D, Bonn F, et al. Whole-exome sequencing identifies homozygous AFG3L2 mutations in a spastic ataxia-neuropathy syndrome linked to mitochondrial m-AAA proteases. PLoS Genet. 2011;7:e1002325. - PMC - PubMed
    1. Muona M, Berkovic SF, Dibbens LM, et al. A recurrent de novo mutation in KCNC1 causes progressive myoclonus epilepsy. Nat Genet. 2015;47:39–46. - PMC - PubMed
    1. Dosi C, Galatolo D, Rubegni A, et al. Expanding the clinical and genetic heterogeneity of SPAX5. Ann Clin Transl Neurol. 2020;7:595–601. - PMC - PubMed

Publication types

Supplementary concepts

Grants and funding