

Ten years of gadolinium retention and deposition: ESMRMB-GREC looks backward and forward
- PMID: 37804341
- PMCID: PMC10791848
- DOI: 10.1007/s00330-023-10281-3
Ten years of gadolinium retention and deposition: ESMRMB-GREC looks backward and forward
Erratum in
-
Correction: Ten years of gadolinium retention and deposition: ESMRMB-GREC looks backward and forward.Eur Radiol. 2024 Jan;34(1):728. doi: 10.1007/s00330-023-10446-0. Eur Radiol. 2024. PMID: 37966523 Free PMC article. No abstract available.
Abstract
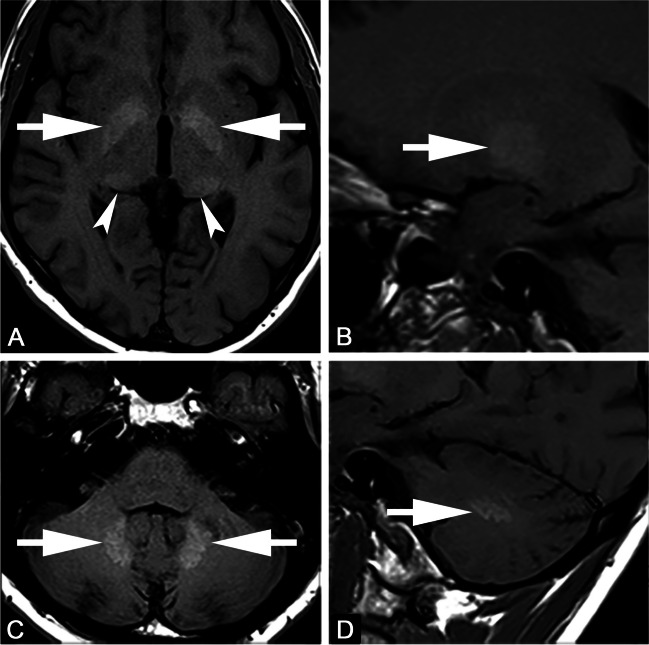
In 2014, for the first time, visible hyperintensities on unenhanced T1-weighted images in the nucleus dentatus and globus pallidus of the brain were associated with previous Gadolinium-based contrast agent (GBCA) injections and gadolinium deposition in patients with normal renal function. This led to a frenzy of retrospective studies with varying methodologies that the European Society of Magnetic Resonance in Medicine and Biology Gadolinium Research and Educational Committee (ESMRMB-GREC) summarised in 2019. Now, after 10 years, the members of the ESMRMB-GREC look backward and forward and review the current state of knowledge of gadolinium retention and deposition. CLINICAL RELEVANCE STATEMENT: Gadolinium deposition is associated with the use of linear GBCA but no clinical symptoms have been associated with gadolinium deposition. KEY POINTS : • Traces of Gadolinium-based contrast agent-derived gadolinium can be retained in multiple organs for a prolonged time. • Gadolinium deposition is associated with the use of linear Gadolinium-based contrast agents. • No clinical symptoms have been associated with gadolinium deposition.
Keywords: Body; Brain; Contrast media; Gadolinium; Magnetic resonance imaging.
© 2023. The Author(s).
Conflict of interest statement
The authors of this manuscript declare relationships with the following companies:
A.J. van der Molen received consultancy fees from Guerbet.
I.A. Dekkers received consultancy fees from Guerbet.
Figures
References
-
- Balzer T (2017) Presence of gadolinium (Gd) in the brain and body. Presentation to the Medical Imaging Drugs Advisory Committee, FDA. Food and Drug Administration, Silver Spring
-
- Endrikat J, Dohanish S, Schleyer N, Schwenke S, Agarwal S, Balzer T. 10 years of nephrogenic systemic fibrosis: a comprehensive analysis of nephrogenic systemic fibrosis reports received by a pharmaceutical company from 2006 to 2016. Invest Radiol. 2018;53:541–550. doi: 10.1097/RLI.0000000000000462. - DOI - PMC - PubMed
-
- Kanda T, Ishii K, Kawaguchi H, Kitajima K, Takenaka D. High signal intensity in the dentate nucleus and globus pallidus on unenhanced T1-weighted MR images: relationship with increasing cumulative dose of a gadolinium-based contrast material. Radiology. 2014;270:834–841. doi: 10.1148/radiol.13131669. - DOI - PubMed
-
- Errante Y, Cirimele V, Mallio CA, Di Lazzaro V, Beomonte Zobel B, Quattrocchi CC. Progressive increase of T1 signal intensity of the dentate nucleus on unenhanced magnetic resonance images is associated with cumulative doses of intravenously administered gadodiamide in patients with normal renal function, suggesting dechelation. Invest Radiol. 2014;49:685–690. doi: 10.1097/RLI.0000000000000072. - DOI - PubMed
Publication types
MeSH terms
Substances
LinkOut - more resources
Full Text Sources
