Review
. 2023 Dec 6;111(23):3716-3738.
doi: 10.1016/j.neuron.2023.09.006. Epub 2023 Oct 6.

Deep-brain optical recording of neural dynamics during behavior

Affiliations
Review

Deep-brain optical recording of neural dynamics during behavior

Zhe Charles Zhou et al. Neuron. .

Abstract

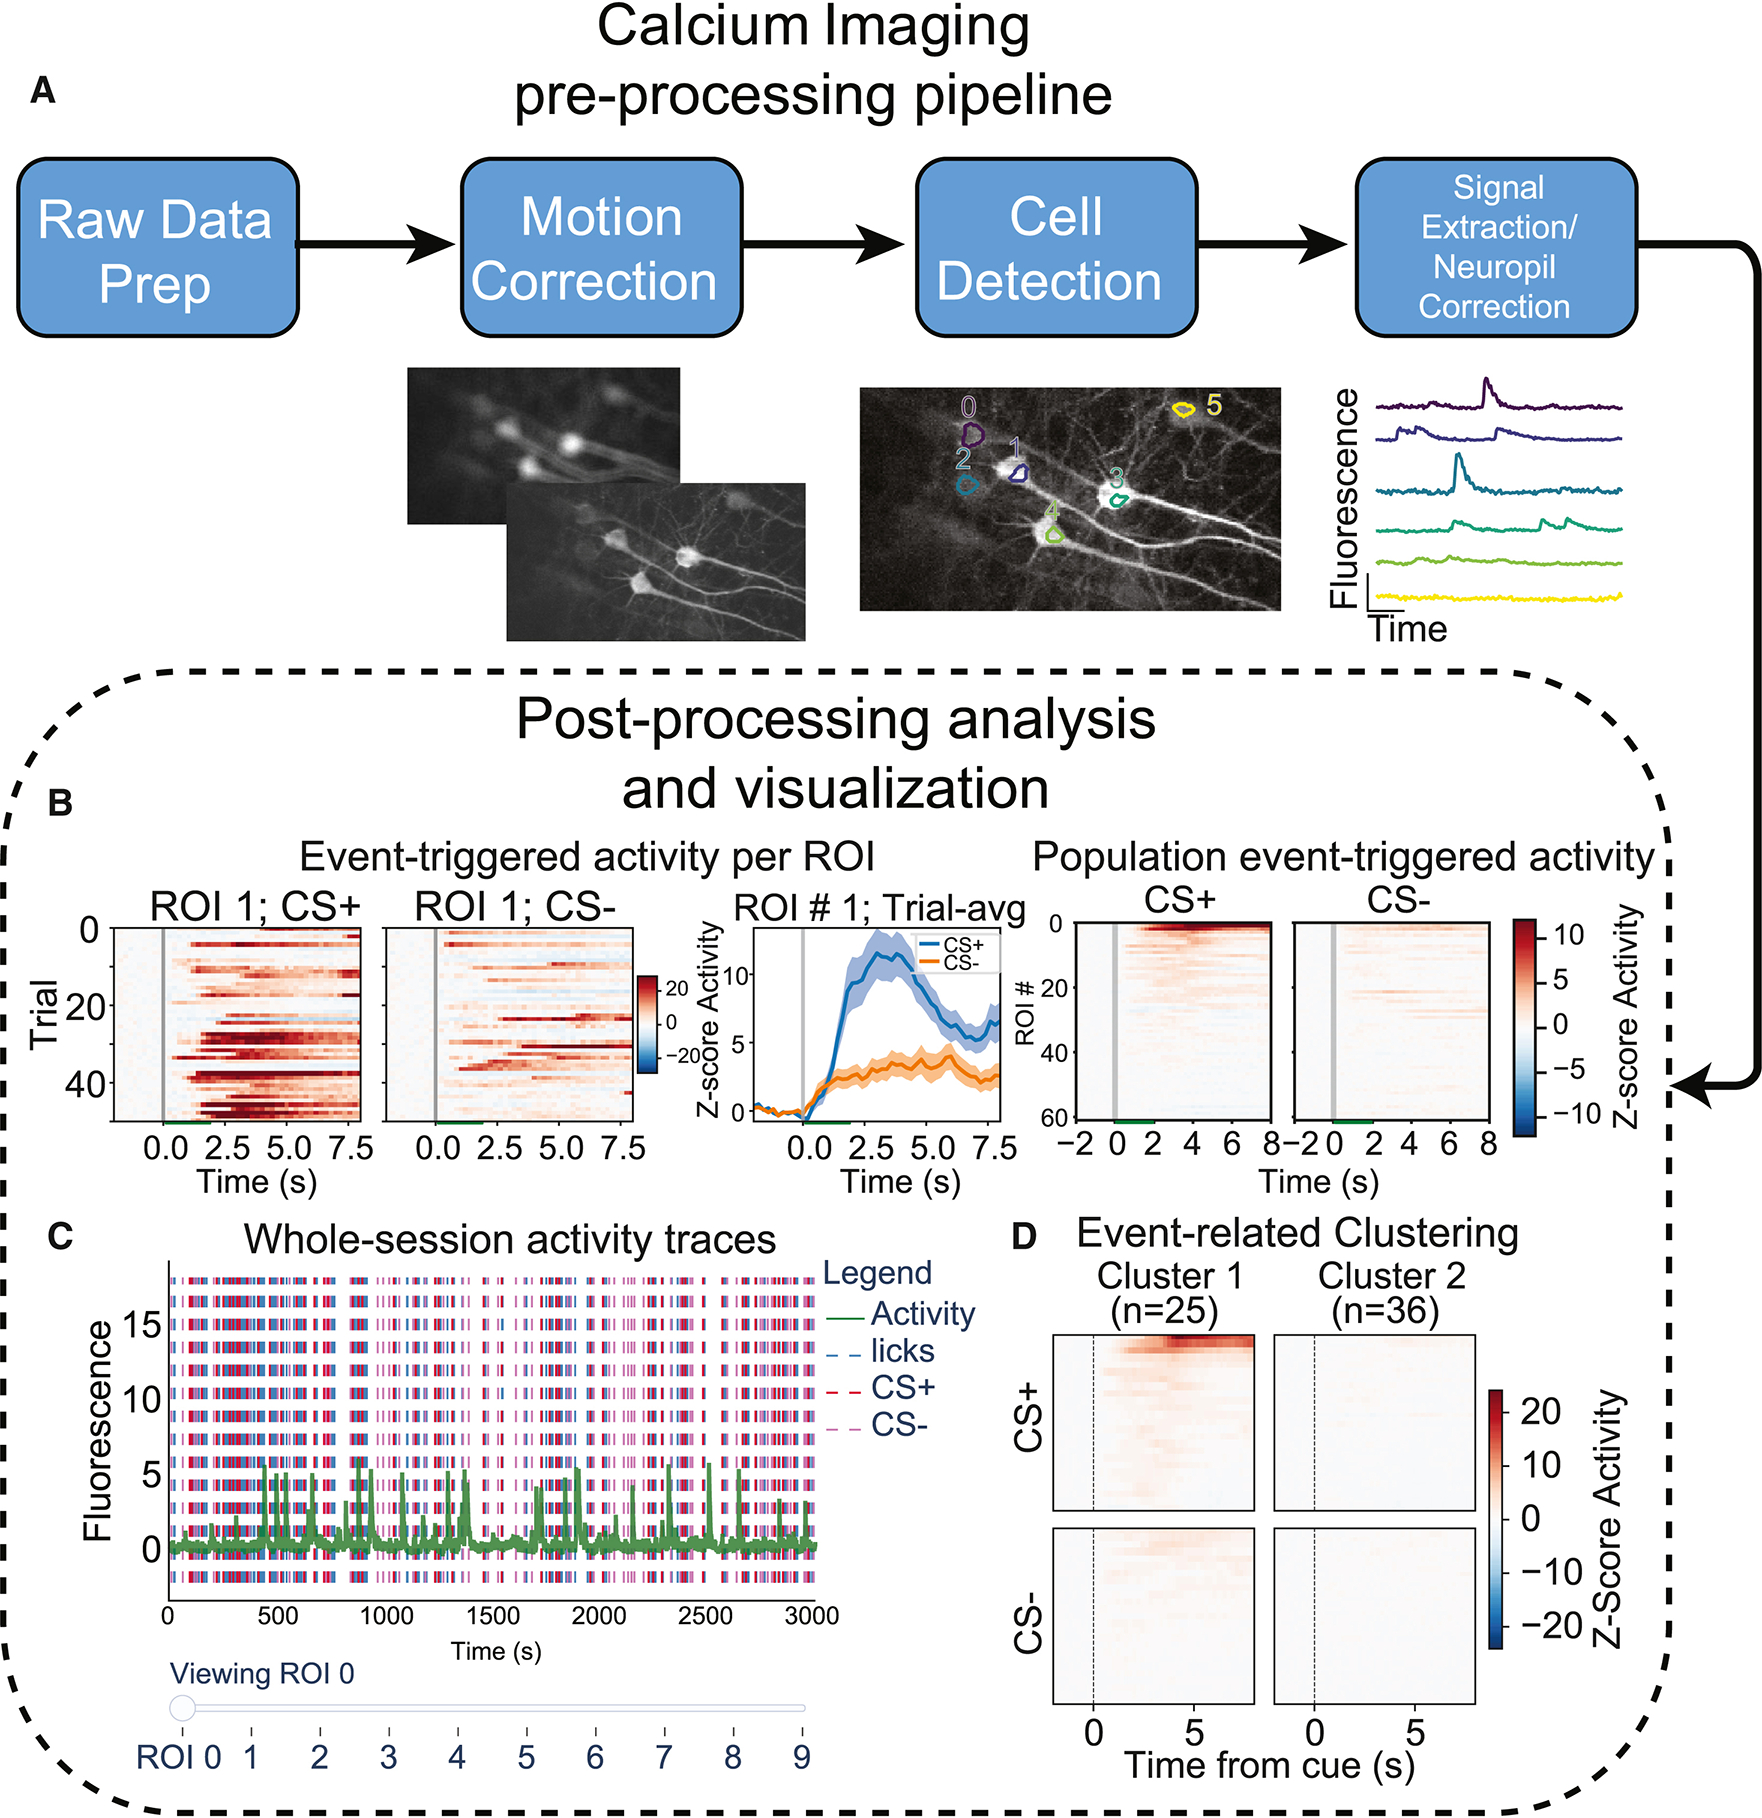
In vivo fluorescence recording techniques have produced landmark discoveries in neuroscience, providing insight into how single cell and circuit-level computations mediate sensory processing and generate complex behaviors. While much attention has been given to recording from cortical brain regions, deep-brain fluorescence recording is more complex because it requires additional measures to gain optical access to harder to reach brain nuclei. Here we discuss detailed considerations and tradeoffs regarding deep-brain fluorescence recording techniques and provide a comprehensive guide for all major steps involved, from project planning to data analysis. The goal is to impart guidance for new and experienced investigators seeking to use in vivo deep fluorescence optical recordings in awake, behaving rodent models.


Conflict of interest statement

Declaration of interests M.R.B. is a co-founder and scientific advisory board member of Neurolux, Inc, a Neurotechnology company. None of the research noted here is related to those efforts.

Figures

Figure 1.
Figure 1.. Deep-brain fluorescence recording methods and experimental timeline.
A) Fiber photometry enables bulk fluorescence recordings through an optical fiber implant in freely-moving subjects. B) Control isosbestic and GCaMP6s fiber photometry signals collected from lateral hypothalamus (LH) VGAT cells. Scale bar represents 50 seconds. C) Miniature microscopy consists of typically a 500–1000um solid GRIN lens implant paired with a detachable miniature microscope that enables cell-resolved imaging in freely-moving subjects. D) Spatially-filtered, motion-corrected mean image collected from GCaMP6s-expressing LH VGAT cells with an Inscopix miniscope. Scale bar represents 50um. E) Deep-brain 2-photon microscopy consists of a GRIN lens implant and a multi-photon microscopy that enables high-resolution imaging in a stationary object. F) Motion-corrected mean image collected from LH VGAT cells with a 2-photon microscope. Scale bar represents 50um. G) Estimated timeline for a fluorescence functional recording experiment from project planning to data acquisition. H) An example of a freely-moving operant experiment compatible with freely-moving fiber photometry and miniscope imaging. I) An example of head-fixed operant experiment compatible with all imaging modalities including commercial multi-photon imaging and holographic stimulation of defined clusters of neurons.
Figure 2.
Figure 2.. Optical implant assemblies and GRIN lens axial magnification properties.
A) Cartoon visualizations of the optical implant assemblies and their respective pros and cons. A conventional microscope objective (not shown) is positioned with its focal plane coincide with the image plane (blue lines) of these assemblies. B) Schematic illustrating axial magnification properties of an example GRIN lens (0.6×7.3mm, 0–200 um working distance, 0.5 NA, product ID: 1050–004626; Inscopix). Each dotted line represents the intermediate plane that microscope objective needs to focus on above the GRIN lens to resolve structures in the corresponding plane (solid line) in the sample below the GRIN lens. Data and plots adapted from Piantadosi et al., 2022.
Figure 3.
Figure 3.. Fiber photometry optical paths and experimental examples.
A) Optical path for fiber photometry GCaMP recordings. 405 nm and 473 nm LEDs emit light on the order or 10’s of uW for isosbestic control and GCaMP excitation. Light becomes further filtered before combining at a dichroic mirror and ultimately exits the filter cube into a fiber optic cable connected to a commutator. A patch cable delivers excitation light and collects biosensor emission lights which passes through the filter cube and collected with a photo-detector. B) Same as in (A) but for a CMOS sensor-based multi-fiber bundle photometry setup, which includes a CMOS camera for resolving signals from a fiber bundle. C) Snippet of 405 nm isosbestic (top purple), GCaMP6s (middle green), and least linear squares (LLS) fit-corrected fiber photometry (bottom gray-bounded green) traces during the same period of time. Recordings were made in VGAT lateral hypothalamus neurons during open field free behavior. D) Cartoon illustration of the viral and recording strategy in O’neal et al. 2022 to record simultaneously from neurons projecting from NAc to ventral tegmental area (VTA) and from NAc to ventral pallidum (VP). E) Simultaneous photometry recordings of GCaMP6s and Chrimson red-shifted opsin stimulation in VGAT lateral hypothalamus neurons. Parameterization of stimulation and frequency and stimulation LED power show graded stimulation-elicited responses.
Figure 4.
Figure 4.. Miniscope and 2-photon microscope optical paths and experimental examples.
A) Optical path for a 1p miniscope. B) 2-photon microscope optical path. Black inset: closeup of objective and GRIN lens. C-D) Simultaneous Chrimson optogenetic stimulation of orbitofrontal cortex (OFC)-striatum terminals and imaging of striatal neurons through a miniscope and GRIN lens. E) Cartoon illustration of holographic 2-photon optogenetics for user-targeted activation of genetically-defined cells. F) Holographic stimulation of orbitofrontal cortex neurons expressing the red-shifted opsin ChRmine through a 1×4 mm GRIN lens. G) Trial-average responses of ROIs in (F). Black arrowheads point to ROIs that were targeted with holographic 2-photon optogenetic stimulation. Green bar indicates duration of stimulation. Inset trace represents the average across all ROIs.
Figure 5.
Figure 5.. Calcium imaging preprocessing and postprocessing/visualization analysis pipeline.
A) Preprocessing step 1) Convert imaging data to package-compatible format (e.g. H5/tiffstack). Step 2) Motion correction to keep cells in consistent locations in video. Step 3) Cell (AKA region-of-interest; ROI) identification. Can be manually defined or automatically detected; see analysis text for tradeoffs. Step 4) Signal extraction including neuropil correction: pixel average traces for each ROI and correction for out-of-focus fluorescence contamination. All data shown in this figure originated from a prior publication B-D) Postprocessing/visualization analyses are optional and can be performed as needed. Examples of such analyses shown in figure: B) ROI activity time-locked to behavioral events to facilitate comparison of timing and amplitude of fluorescence response across trials, ROIs, and conditions. C) Fluorescence activity plotted across the whole session with vertical lines indicating event onset times. This visualization is useful for validating behavioral time-stamps are accurate and provide a large-scale view of the data. D) Spectral clustering of ROIs based on event-related activity across conditions. ROIs are automatically clustered based on similarity in response dynamics across trial-averaged event-related epochs.

References

    1. Wang Y, DeMarco EM, Witzel LS, and Keighron JD (2021). A selected review of recent advances in the study of neuronal circuits using fiber photometry. Pharmacol. Biochem. Behav. 201, 173113. 10.1016/j.pbb.2021.173113. - DOI - PubMed
    1. Ghosh KK, Burns LD, Cocker ED, Nimmerjahn A, Ziv Y, Gamal AE, and Schnitzer MJ (2011). Miniaturized integration of a fluorescence microscope. Nat. Methods 8, 871–878. 10.1038/nmeth.1694. - DOI - PMC - PubMed
    1. Cai DJ, Aharoni D, Shuman T, Shobe J, Biane J, Song W, Wei B, Veshkini M, La-Vu M, Lou J, et al. (2016). A shared neural ensemble links distinct contextual memories encoded close in time. Nature 534, 115–118. 10.1038/nature17955. - DOI - PMC - PubMed
    1. Helmchen F, Fee MS, Tank DW, and Denk W (2001). A miniature head-mounted two-photon microscope. high-resolution brain imaging in freely moving animals. Neuron 31, 903–912. 10.1016/s0896-6273(01)00421-4. - DOI - PubMed
    1. Zong W, Obenhaus HA, Skytøen ER, Eneqvist H, de Jong NL, Vale R, Jorge MR, Moser M-B, and Moser EI (2022). Large-scale two-photon calcium imaging in freely moving mice. Cell 185, 1240–1256.e30. 10.1016/j.cell.2022.02.017. - DOI - PMC - PubMed

Publication types

LinkOut - more resources