. 2023 Oct 7;14(1):6280.
doi: 10.1038/s41467-023-41963-7.

Metabolic phenotyping of BMI to characterize cardiometabolic risk: evidence from large population-based cohorts

Affiliations

Metabolic phenotyping of BMI to characterize cardiometabolic risk: evidence from large population-based cohorts

Habtamu B Beyene et al. Nat Commun. .

Abstract

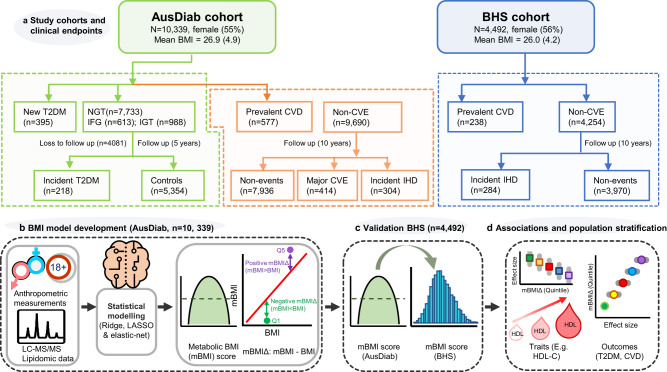
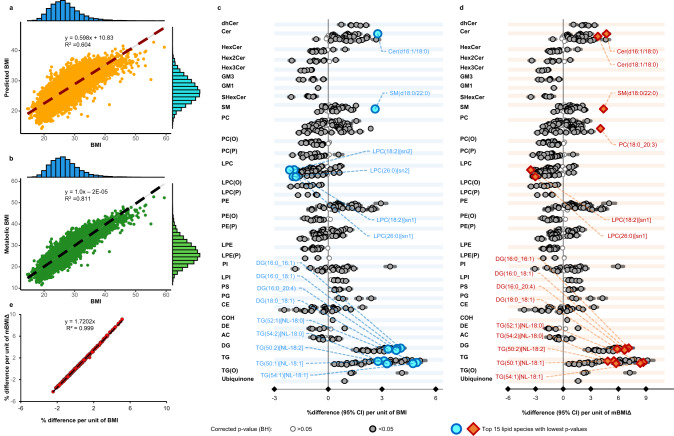
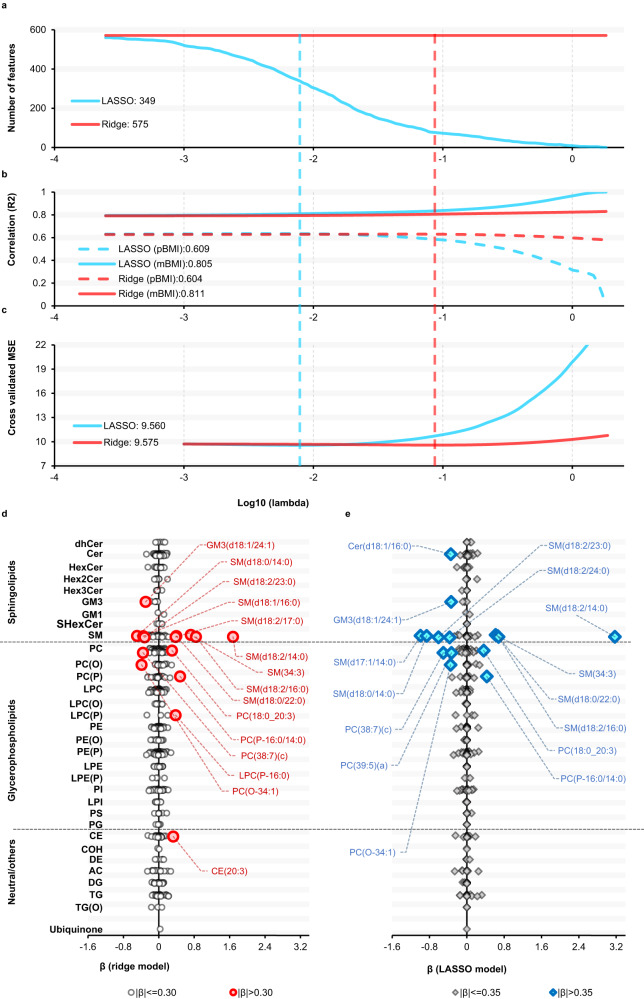
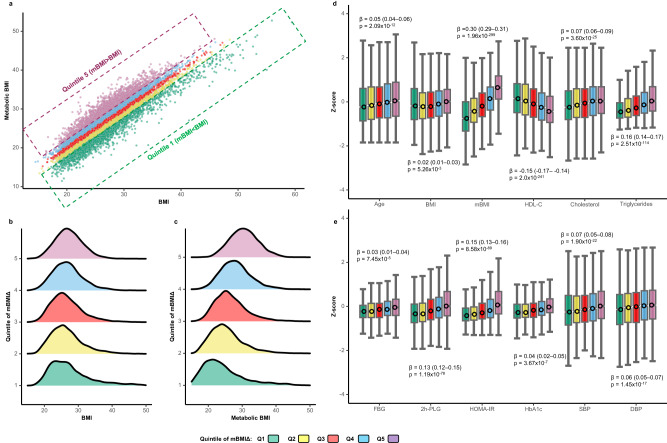
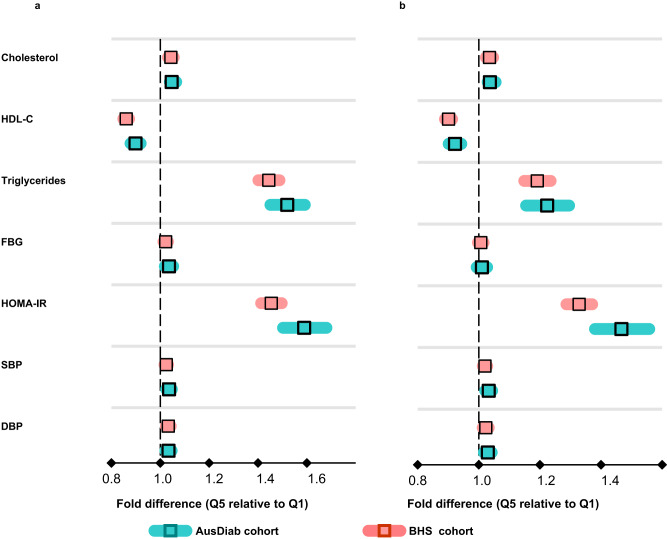
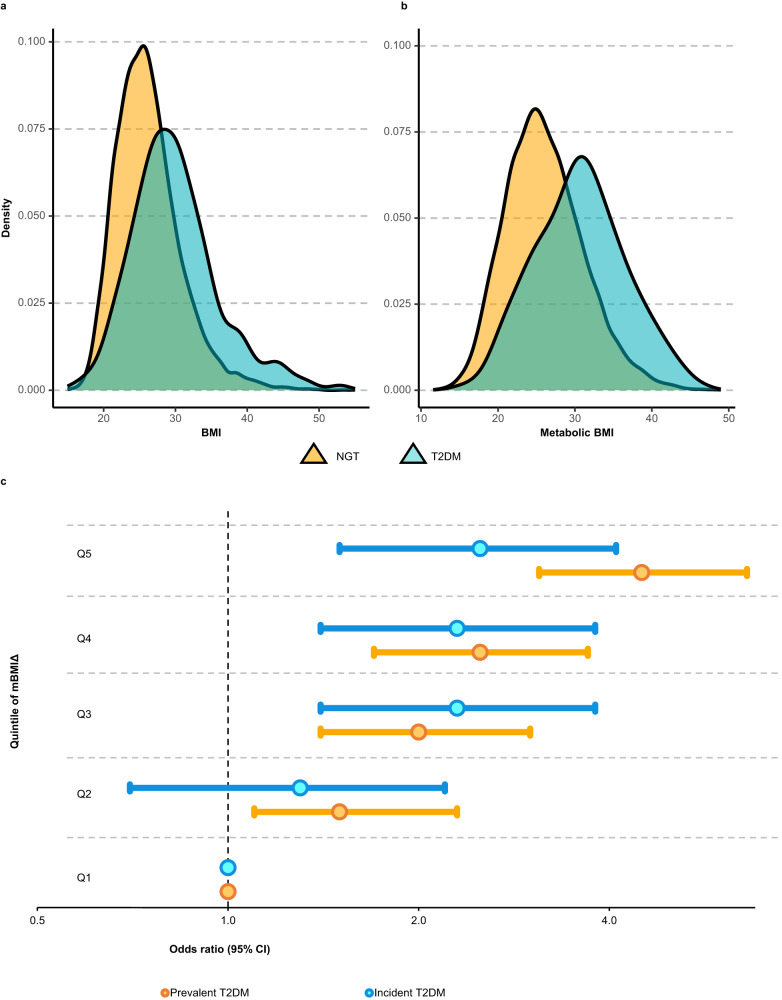
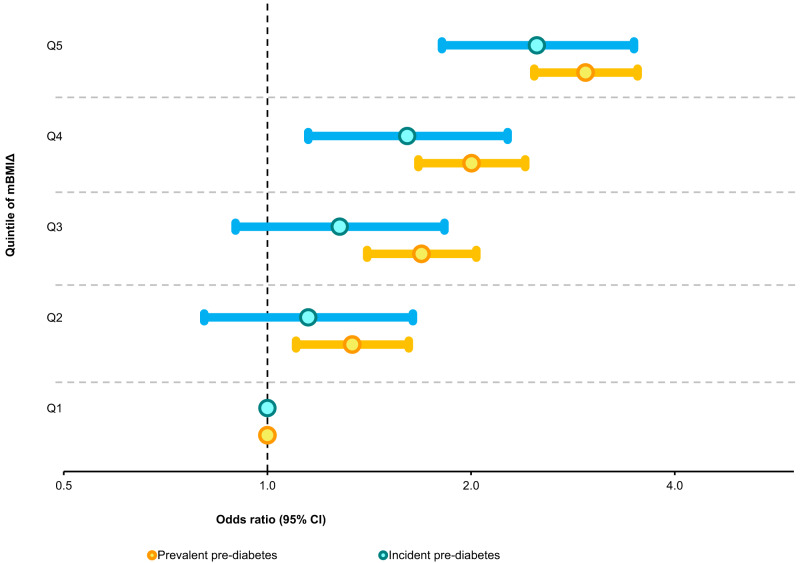
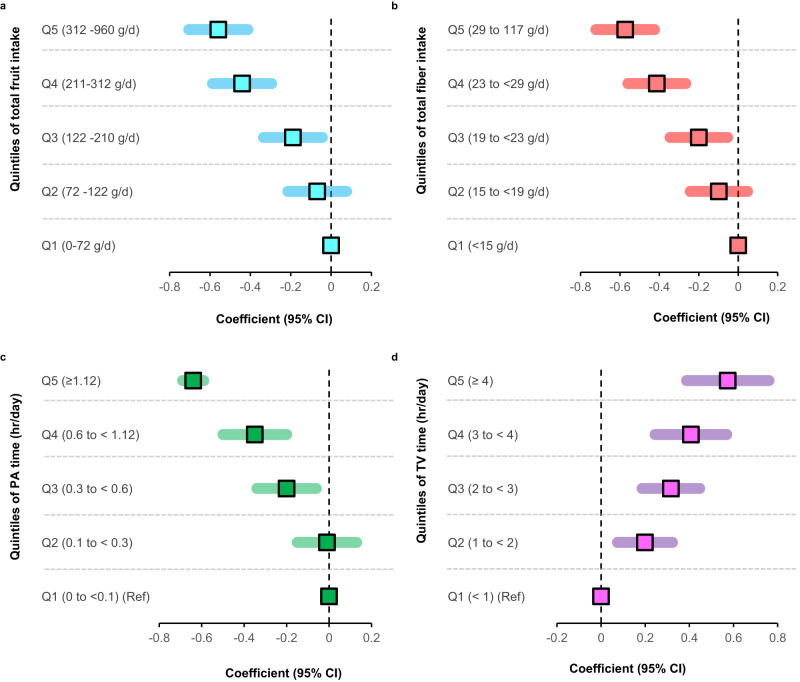
Obesity is a risk factor for type 2 diabetes and cardiovascular disease. However, a substantial proportion of patients with these conditions have a seemingly normal body mass index (BMI). Conversely, not all obese individuals present with metabolic disorders giving rise to the concept of "metabolically healthy obese". We use lipidomic-based models for BMI to calculate a metabolic BMI score (mBMI) as a measure of metabolic dysregulation associated with obesity. Using the difference between mBMI and BMI (mBMIΔ), we identify individuals with a similar BMI but differing in their metabolic health and disease risk profiles. Exercise and diet associate with mBMIΔ suggesting the ability to modify mBMI with lifestyle intervention. Our findings show that, the mBMI score captures information on metabolic dysregulation that is independent of the measured BMI and so provides an opportunity to assess metabolic health to identify "at risk" individuals for targeted intervention and monitoring.


Conflict of interest statement

The authors declare no competing interests.

Figures

Fig. 1
Fig. 1. An overview of the study design for the development of metabolic BMI scores and the subsequent downstream analyses.
a Study participants and clinical end-points in the AusDiab and BHS cohorts. b BMI model development: lipidomic data was used for the generation of the metabolic BMI score in the discovery cohort (AusDiab) using linear models. c External validation of the mBMI score in the BHS cohort. d Downstream analyses (association of the metabolic BMI scores with cardiometabolic traits and outcomes). AusDiab Australian Diabetes, Obesity and Lifestyle Study, BHS Busselton Health Study, BMI body mass index, mBMI metabolic BMI, mBMIΔ metabolic BMI delta, IGT impaired glucose tolerance, IFG impaired fasting glucose, NGT normal glucose tolerance, T2DM type 2 diabetes mellitus, CVD cardiovascular disease, CVE cardiovascular event, IHD ischemic heart disease, LC-MS/MS liquid chromatography tandem mass spectrometry.
Fig. 2
Fig. 2. Modelling of the metabolic BMI score and comparison of the captured lipid biology with BMI in the AusDiab cohort (n = 10,339 independent samples).
a Correlation between measured BMI and predicted BMI (orange scatter plot). The blue and sky-blue histogram depicts the distribution of BMI and predicted BMI respectively. b Correlation between measured BMI and metabolic BMI (mBMI) (green scatterplot). The blue and green histogram depicts the distribution of BMI and metabolic BMI respectively. c Associations of BMI (as a predictor) with plasma lipid species (as outcome, n = 575 species) and (d) association of mBMIΔ with plasma lipid species using linear regression analysis adjusting for age and sex. Two-sided p values for each lipid species with grey open circles (p > 0.05), grey and dark closed circles (p < 0.05) are presented after correction for multiple comparisons using the method of Benjamini and Hochberg. Blue circles and brown diamonds represent the top 15 most significant lipid species associated with BMI (p < 10–217) and mBMIΔ (p < 10–157), respectively. Each data point in (c) and (d) represent coefficients (% differences) per unit of BMI (c) or mBMIΔ (d) and the error bars represent 95% confidence intervals (CI). e The correlation between effect sizes of each lipid associated with BMI (x-axis) and with mBMIΔ (y-axis). Additional details are shown in Supplementary Data 1 and 2. AC acylcarnitine, CE cholesteryl ester, Cer ceramide, COH cholesterol, DE dehydrocholesterol, dhCer dihydroceramide, DG diacylglycerol, GM1 GM1 ganglioside, GM3 GM3 ganglioside, HexCer monohexosylceramide, Hex2Cer dihexosylceramide, Hex3Cer trihexosylceramide, LPC lysophosphatidylcholine, LPC(O) lysoalkylphosphatidylcholine, LPC(P) lysoalkenylphosphatidylcholine, LPE lysophosphatidylethanolamine, LPE(P) lysoalkenylphosphatidylethanolamine, LPI lysophosphatidylinositol, PC phosphatidylcholine, PC(O) alkylphosphatidylcholine, PC(P) alkenylphosphatidylcholine, PE phosphatidylethanolamine, PE(O) alkylphosphatidylethanolamine, PE(P) alkenylphosphatidylethanolamine, PG phosphatidylglycerol, PI phosphatidylinositol, PS phosphatidylserine, SHexCer sulfatide, SM sphingomyelin, TG triacylglycerol, TG(O) alkyl-diacylglycerol.
Fig. 3
Fig. 3. The performance of ridge and LASSO models.
a The number of features incorporated in the ridge (red line) and LASSO (blue line) models for different lambda values. b The correlation (R2) of BMI and pBMI (dashed lines) or BMI and mBMI (solid lines) in ridge (red line) and LASSO models (blue line) for different lambda values. c MSE of the difference between the observed and predicted values for ridge (red line) and LASSO models (blue line). The vertical dashed red and blue lines represent the minimum MSE, for ridge and LASSO models respectively (i.e., the optimum lambda used to make the models). d A plot of beta coefficients from the optimum ridge model. e A plot of beta coefficients from the optimum LASSO model. Red circles and blue diamonds represent the top 15 lipid species (ranked based on the absolute value of beta coefficients) showing the strongest contribution in the ridge and LASSO models respectively. AC acylcarnitine, CE cholesteryl ester, Cer ceramide, COH cholesterol, DE dehydrocholesterol, dhCer dihydroceramide, DG diacylglycerol, GM1 GM1 ganglioside, GM3 GM3 ganglioside, HexCer monohexosylceramide, Hex2Cer dihexosylceramide, Hex3Cer trihexosylceramide, LPC lysophosphatidylcholine, LPC(O) lysoalkylphosphatidylcholine, LPC(P) lysoalkenylphosphatidylcholine, LPE lysophosphatidylethanolamine, LPE(P) lysoalkenylphosphatidylethanolamine, LPI lysophosphatidylinositol, PC phosphatidylcholine, PC(O) alkylphosphatidylcholine, PC(P) alkenylphosphatidylcholine, PE phosphatidylethanolamine, PE(O) alkylphosphatidylethanolamine, PE(P) alkenylphosphatidylethanolamine, PG phosphatidylglycerol, PI phosphatidylinositol, PS phosphatidylserine, SHexCer sulfatide, SM sphingomyelin, TG triacylglycerol, TG(O) alkyl-diacylglycerol. Source data are provided as a Source Data file.
Fig. 4
Fig. 4. The relationship between mBMIΔ and cardiometabolic traits.
a Correlation between mBMI and BMI for all individuals across the quintiles of mBMIΔ in the AusDiab dataset (n = 10,339). The green, yellow, red, blue, and pink marks show individuals in the Q1 (n = 2068), Q2 (n = 2068), Q3 (n = 2067), Q4 (n = 2068) and Q5 (n = 2068) of mBMIΔ respectively. b Density histograms of BMI distribution for each mBMIΔ quintile. c Density histograms of mBMI distribution for each mBMIΔ quintile. d, e Box plots of the association of mBMIΔ with cardiometabolic traits. Box plots represent the distribution of z-scores of the respective cardiometabolic trait in each quintile of mBMIΔ. The data depicted in the box and whisker plots for (d) and (e) span from the minimum to the maximum values (z-score). The lower and upper boundaries of the box correspond to the 25th and 75th percentiles, respectively, and the central open circles within the boxes represent the median values. Linear regression analyses of mBMIΔ quintile (predictor) against cardiometabolic traits (outcome) were performed. β-coefficients and p values (two-sided) from the linear regression analyses are presented. No adjustments were made for multiple comparisons. BMI body mass index, HDL-C high density cholesterol, HOMA-IR homeostatic model assessment of insulin resistance, FBG fasting blood glucose, 2h-PLG 2-h post load glucose, SBP systolic blood pressure, DBP diastolic blood pressure, HbA1C haemoglobin A1c. Source data are provided as a Source Data file.
Fig. 5
Fig. 5. Validation of the association of cardiometabolic risk factors with metabolic discordant groups.
Linear regression analyses between metabolic traits (outcomes) and the discordant mBMIΔ groups (predictor, Q5 relative to Q1) were performed adjusting for (a) age, sex, and BMI and (b) age, sex, BMI, total cholesterol, HDL-C, and triglycerides (excluding the outcome) in the AusDiab cohort, n = 10, 339 (blue green boxes) and the BHS cohort, n = 4492 (pink boxes). Each square represents the fold difference (Q5 relative to Q1 of mBMIΔ) for a given metabolic trait. The whiskers represent 95% CIs. HDL-C high density cholesterol, HOMA-IR homeostatic model assessment of insulin resistance, FBG fasting blood glucose, SBP systolic blood pressure, DBP diastolic blood pressure.
Fig. 6
Fig. 6. The relationship between mBMIΔ and T2DM.
a Density histogram showing the distribution of BMI in T2DM and NGT subjects. b Density histogram showing the distribution of mBMI in T2DM and NGT subjects. c The forest plot displays the odds ratio (x-axis) associated with moving from Q1 of mBMIΔ (reference quintile) to Q2–Q5 (y-axis) for the newly diagnosed prevalent T2DM (yellow circles) and 5-year incident T2DM (sky-blue circles) compared to controls. The odds ratios were computed from a multiple logistic regression between a newly diagnosed prevalent T2DM, n = 395 versus 7733 NGT subjects at baseline or incident T2DM, n = 218 cases versus 5354 controls free of T2DM and the quintiles of the mBMIΔ (Q1 as a reference) adjusted for age, sex, and BMI. Error bars represent 95% CIs. Odds ratios and the associated CIs were log2 transformed to enhance visualization. The results for clinical lipid, familial history of diabetes and smoking status adjusted models are provided in Supplementary Table 5.
Fig. 7
Fig. 7. The relationship between mBMIΔ and pre-diabetes.
Depicted on the x-axis of the forest plot are the odds ratios (on a log2 scale) for subjects with the prevalent pre-diabetes (gold circles) and 5-year incident pre-diabetes (sky-blue circles) compared to the controls across the quintiles of mBMIΔ (y-axis). The odds ratios were computed using a logistic regression between prevalent pre-diabetes, n = 1920/7733 NGT or incident pre-diabetes, n = 417/4023 NGT and the quintiles of the mBMIΔ (Q1 as a reference) adjusted for age, sex, and BMI in the AusDiab cohort. Each circle and the horizontal errors bars (95% CI) for the quintiles (Q2–Q4) represent the odds of pre-diabetes associated with moving from the reference quintile (Q1, OR = 1). Detailed associations including clinical lipids and smoking adjusted analyses are presented in Supplementary Table 6.
Fig. 8
Fig. 8. Associations of dietary and lifestyle habits with mBMIΔ.
Forest plots show age, sex and BMI adjusted coefficients (95% CIs) (x-axis) in a multiple linear regression analysis of mBMIΔ against (a) the quintiles of total fruit intake (b) quintiles of fibre intake (c) PA level in hrs/day and (d) TV viewing time in hrs/day. Square boxes represent the coefficients (units of mBMIΔ in Kg/m2) associated with moving from the reference quintile (Q1) to Q2 – Q5 of each diet or lifestyle. PA, physical activity; TV, television. Source data are provided as a Source Data file.

Similar articles

Cited by

References

    1. Neeland IJ, Poirier P, Després J-P. Cardiovascular and metabolic heterogeneity of obesity. Circulation. 2018;137:1391–1406. doi: 10.1161/CIRCULATIONAHA.117.029617. - DOI - PMC - PubMed
    1. Ng M, et al. Global, regional, and national prevalence of overweight and obesity in children and adults during 1980–2013: a systematic analysis for the Global Burden of Disease Study 2013. Lancet. 2014;384:766–781. doi: 10.1016/S0140-6736(14)60460-8. - DOI - PMC - PubMed
    1. Collaborators GBDO, A.A., Forouzanfar MH, Reitsma. Health effects of overweight and obesity in 195 countries over 25 years. N. Engl. J. Med. 2017;377:13–27. doi: 10.1056/NEJMoa1614362. - DOI - PMC - PubMed
    1. Oguoma VM, et al. Prevalence of overweight and obesity, and associations with socio-demographic factors in Kuwait. BMC Public Health. 2021;21:667. doi: 10.1186/s12889-021-10692-1. - DOI - PMC - PubMed
    1. Choquet H, Meyre D. Genetics of obesity: What have we learned? Curr. Genomics. 2011;12:169–179. doi: 10.2174/138920211795677895. - DOI - PMC - PubMed

Publication types

MeSH terms