. 2023 Oct 7;14(1):37.
doi: 10.1186/s13229-023-00570-5.

EEG functional connectivity in infants at elevated familial likelihood for autism spectrum disorder

Collaborators, Affiliations

EEG functional connectivity in infants at elevated familial likelihood for autism spectrum disorder

Christian O'Reilly et al. Mol Autism. .

Abstract

Background: Many studies have reported that autism spectrum disorder (ASD) is associated with atypical structural and functional connectivity. However, we know relatively little about the development of these differences in infancy.

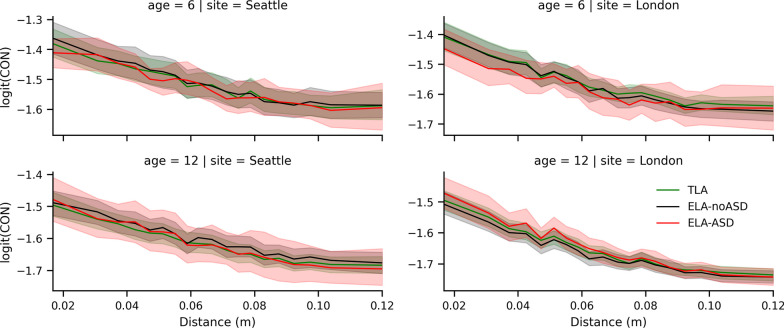
Methods: We used a high-density electroencephalogram (EEG) dataset pooled from two independent infant sibling cohorts, to characterize such neurodevelopmental deviations during the first years of life. EEG was recorded at 6 and 12 months of age in infants at typical (N = 92) or elevated likelihood for ASD (N = 90), determined by the presence of an older sibling with ASD. We computed the functional connectivity between cortical sources of EEG during video watching using the corrected imaginary part of phase-locking values.

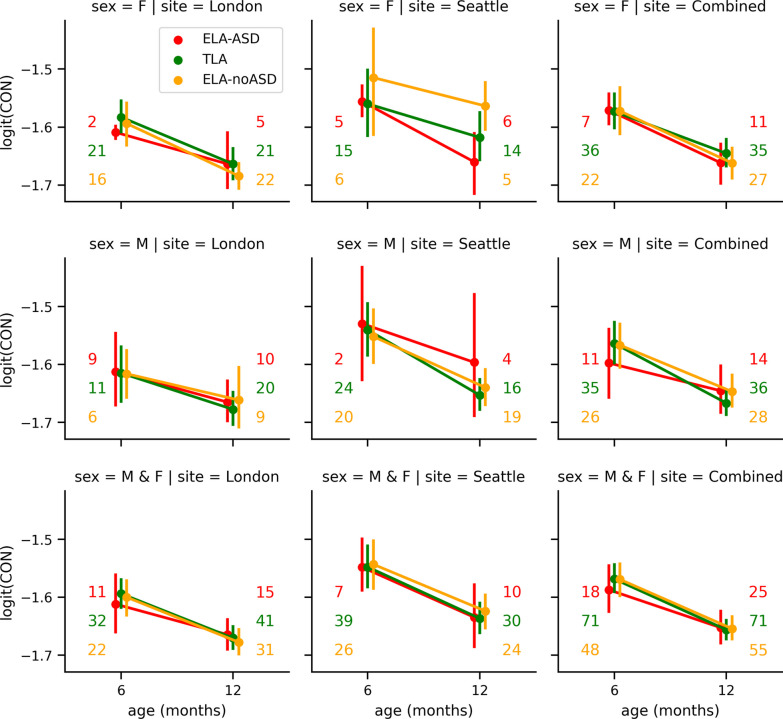
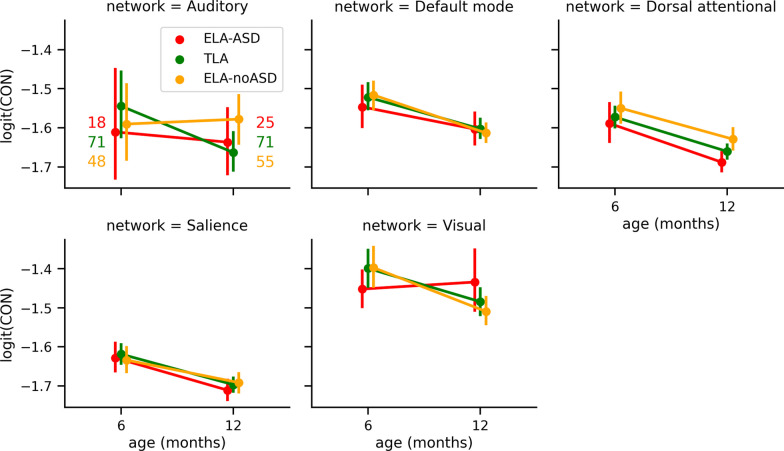
Results: Our main analysis found no significant association between functional connectivity and ASD, showing only significant effects for age, sex, age-sex interaction, and site. Given these null results, we performed an exploratory analysis and observed, at 12 months, a negative correlation between functional connectivity and ADOS calibrated severity scores for restrictive and repetitive behaviors (RRB).

Limitations: The small sample of ASD participants inherent to sibling studies limits diagnostic group comparisons. Also, results from our secondary exploratory analysis should be considered only as potential relationships to further explore, given their increased vulnerability to false positives.

Conclusions: These results are inconclusive concerning an association between EEG functional connectivity and ASD in infancy. Exploratory analyses provided preliminary support for a relationship between RRB and functional connectivity specifically, but these preliminary observations need corroboration on larger samples.

Keywords: ADOS; Autism spectrum disorder; Electroencephalography; Functional connectivity; Infants; Longitudinal; Sex differences; Sibling studies; Source reconstruction.


Conflict of interest statement

Simon Baron-Cohen is Editor-in-Chief and Sara Jane Webb Associate Editor of Molecular Autism. The other authors declare that they have no competing interests.

Figures

Fig. 1
Fig. 1
Average logit-transformed CIPLV connectivity. Displayed as a function of the age (x-axis), the site (columns), biological sex (row), and the diagnostic outcome groups (color). Whiskers represent the bootstrapped 95% confidence intervals. These plots are for all-to-all connectivity averaged by recording. Displayed are the mean values and their bootstrapped 95% confidence intervals. Numbers next to the whiskers indicate the number of participants for each condition
Fig. 2
Fig. 2
Functional connectivity within and between groups. The three upper circular connectivity plots show the most strongly connected pairs of regions for each diagnostic group. Similarly, the two lower graphs show the strongest differences in connectivity between the TLA and the two subgroups of ELA infants. The three top and two bottom graphs have been plotted using the same color scale to allow fair comparisons. The left (right) strip of circular plots corresponds to the regions of the left (right) hemisphere. Brain regions are color-coded, and their order in the circular plot is the same for each hemisphere (i.e., the superiortemporal region is represented for both hemispheres with the same cyan color, and the regions from the two hemispheres are arranged symmetrically). The position of the regions, from posterior (bottom) to anterior (top), and their color-coding are shown in the legend on the left side of the figure. These plots only show the 100 region pairs with the largest CIPLV connectivity (top three panels) and the 100 pairs with the largest between-group differences in CIPLV connectivity (bottom two panels)
Fig. 3
Fig. 3
Logit-transformed CIPLV values within the different resting-state networks. Displayed per network (different panels), for the different time points (x-axis), and diagnostic groups (color). Whiskers represent the bootstrapped 95% confidence interval. Sample sizes indicated on the first panel are the same for all networks
Fig. 4
Fig. 4
Average logit-transformed CIPLV connectivity as a function of the distance. Displayed between regions (x-axis), age (rows), site (columns), and group (color). To smooth these lines, distances are split into 20 bins, each covering 5% of the distribution. Shaded regions show 95% bootstrapped confidence intervals
Fig. 5
Fig. 5
Regression between the logit-transformed CIPLV connectivity and ADOS calibrated severity scores for the ELA infants. Displayed per sex (rows), time point (columns), and sites (blue: London; red: Seattle; black: Pooled). The dashed lines indicate the average connectivity for TLA infants. Pearson’s coefficients of correlation (r) are indicated, along with p values from robust linear univariate regressions. Stars indicate participants diagnosed with ASD, whereas dots indicate individuals without ASD. Samples sizes are indicated for both sites (sample sizes for ELA-ASD are shown in parenthesis). Sample sizes for the pooled dataset have been omitted to save space but equal the sum of the sample sizes for both sites. a Social affect. b RRB. Similar plots for the overall ADOS CSS are shown in Supplementary Fig. 7

Update of

References

    1. Modabbernia A, Velthorst E, Reichenberg A. Environmental risk factors for autism: an evidence-based review of systematic reviews and meta-analyses. Mol Autism. 2017;8:13. - PMC - PubMed
    1. Rylaarsdam L, Guemez-Gamboa A. Genetic causes and modifiers of autism spectrum disorder. Front Cell Neurosci. 2019;13:385. - PMC - PubMed
    1. Currenti SA. Understanding and determining the etiology of autism. Cell Mol Neurobiol. 2010;30:161–171. - PMC - PubMed
    1. Dalton KM, Nacewicz BM, Alexander AL, Davidson RJ. Gaze-fixation, brain activation, and amygdala volume in unaffected siblings of individuals with autism. Biol Psychiatry. 2007;61:512–520. - PubMed
    1. Pickles A, Wright N, Bedford R, Steiman M, Duku E, Bennett T, et al. Predictors of language regression and its association with subsequent communication development in children with autism. J Child Psychol Psychiatry. 2022;63:1243–1251. - PMC - PubMed

Publication types