. 2023 Oct 7;14(1):6277.
doi: 10.1038/s41467-023-41906-2.

Ecological network analysis reveals cancer-dependent chaperone-client interaction structure and robustness

Affiliations

Ecological network analysis reveals cancer-dependent chaperone-client interaction structure and robustness

Geut Galai et al. Nat Commun. .

Abstract

Cancer cells alter the expression levels of metabolic enzymes to fuel proliferation. The mitochondrion is a central hub of metabolic reprogramming, where chaperones service hundreds of clients, forming chaperone-client interaction networks. How network structure affects its robustness to chaperone targeting is key to developing cancer-specific drug therapy. However, few studies have assessed how structure and robustness vary across different cancer tissues. Here, using ecological network analysis, we reveal a non-random, hierarchical pattern whereby the cancer type modulates the chaperones' ability to realize their potential client interactions. Despite the low similarity between the chaperone-client interaction networks, we highly accurately predict links in one cancer type based on another. Moreover, we identify groups of chaperones that interact with similar clients. Simulations of network robustness show that this group structure affects cancer-specific response to chaperone removal. Our results open the door for new hypotheses regarding the ecology and evolution of chaperone-client interaction networks and can inform cancer-specific drug development strategies.


Conflict of interest statement

The authors declare no competing interests.

Figures

Fig. 1
Fig. 1. Non-random patterns in chaperone realized niche across cancer environments.
Each square depicts the number of clients a chaperone interacts with in a specific cancer out of all the clients it could potentially interact with (Rcα=Lcα/Pc; realized niche, see text). The cancer environment affects the realized niche of chaperones, as is evident from the non-uniform colors in each row. Chaperones vary in their realized niche within the same cancer type, as is evident from the non-uniform colors in each column. The matrix is significantly weighted-nested, with a core of chaperones with highly realized niche values in particular environments. A core of four cancer types and four chaperones (arbitrary selection) is depicted as an example by the black square. Rows and columns are arranged by their marginal sums. A similar weighted-nested pattern was found for chaperone cancer-specific specialization (Supplementary Fig. S1B).
Fig. 2
Fig. 2. Chaperone expression levels.
a The lof10 median values of chaperone expression levels across cancers (n = 12). Some chaperones are more expressed than others. Box plots: horizontal line is median, lower and upper hinges are the 25th and 75th percentiles, lower and upper whiskers are 1.5*IQR, and points are outliers b Each scatter plot presents the distribution of a single chaperone’s realized niche over its log10 gene expression across cancers (each data point is a cancer type). Spearman correlations combined with Bonferroni corrections between these two indices result in non-significant p-values for all chaperones (see Supplementary Table S3).
Fig. 3
Fig. 3. Comparison of client identities between cancers.
a Distribution of the similarity in client identities that a chaperone interacts with between two cancer types calculated as Jcαβ for observed (red) and counterpart shuffled networks (blue). In the observed networks, 66 comparisons for 15 chaperones totaled 990 values of Jcαβ. In the shuffled networks, there are 1000 values per observed value. Chaperones tend to conserve interacting proteins to a limited degree but statistically significantly more than expected at random. b Each data point is a chaperone. x-axis values are the partner fidelity Jc, defined as the median of Jcαβ (horizontal bars are the range of Jcαβ). y-axis values are the realized niche Rcα (vertical bars are the range of Rcα). There is a positive and significant correlation (Spearman, two-tailed) between Jcαβ and Rcα.
Fig. 4
Fig. 4. Niche separation and redundancy in chaperone interaction partners.
a The Jaccard similarity index for each pair of chaperones in a specific cancer (Jxyα; see text). The green and purple histograms depict values across all cancers for the observed and shuffled networks, respectively. The observed distribution contains 1260 pairwise comparisons (105 pairwise chaperone comparisons in 12 cancer types). The shuffled distribution contains 1000 values per observed comparison. There is a mode of lower than random Jxyα, indicating that chaperones interact with significantly different sets of clients within a cancer type. However, there is also a tail with chaperone pairs that highly overlap in the clients they interact with. b Using a stochastic block model, we find that chaperones are partitioned into two groups. Black and blue denominations are chaperones and co-chaperones, respectively. c Because of the mixed membership structure of the multilayer SBM, we can measure to what extent information in any layer helps us predict links in the same (diagonal values) or another (off-diagonal values) layer. The y-axis and x-axis are the predicted layer and the extra layer used to help the prediction, respectively. We use 20% of the information from the predicted layer plus all of the information from another layer, which can be the same layer (diagonal) or another (off-diagonal). Cell values are the area under an ROC curve, a common measure for evaluating prediction accuracy. A value of 0.5 indicates that links can be predicted at random (50% of guessing right). We predict links with high accuracy (range 0.59–0.71 in the diagonal and 0.83–0.98 in the off-diagonal). d Jaccard similarity of the interactions between layers. Although layers are highly dissimilar, links are highly predictable.
Fig. 5
Fig. 5. Robustness to chaperone removal.
The collapse process of each network can be described by calculating the proportion of clients that remain connected to at least one chaperone as a function of chaperone removal. There were four scenarios of chaperone removal order. Network robustness T is calculated as the area under the curve. Values of T are depicted for each scenario in its corresponding color.
Fig. 6
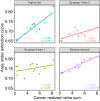
Fig. 6. Correlation between robustness and realized niche.
Each panel shows a scenario of the node removal order. Each data point is a cancer type. A positive and significant correlation (two-tailed Spearman correlation values within the panels) indicates that cancer environments that enable chaperones to interact with a high proportion of the clients they can potentially interact with (high realized niche), will also be more robust to chaperone removal. Random removal serves as a control: we expect a strong positive correlation because when nodes are removed randomly, robustness is a function of network size and the number of links rather than of the removed nodes.

References

    1. Faubert, B., Solmonson, A. & DeBerardinis, R. J. Metabolic reprogramming and cancer progression. Science368, eaaw5473 (2020). - PMC - PubMed
    1. Jadiya, P. & Tomar, D. Mitochondrial protein quality control mechanisms. Genes11, 563 (2020). - PMC - PubMed
    1. Voos W. Chaperone-protease networks in mitochondrial protein homeostasis. Biochim. Biophys. Acta. 2013;1833:388–399. - PubMed
    1. Masgras I, et al. The molecular chaperone TRAP1 in cancer: from the basics of biology to pharmacological targeting. Semin. Cancer Biol. 2021;76:45–53. - PubMed
    1. Polson, E. S. et al. KHS101 disrupts energy metabolism in human glioblastoma cells and reduces tumor growth in mice. Sci. Transl. Med. 10, eaar2718 (2018). - PubMed

Publication types

Substances