

A cell transcriptomic profile provides insights into adipocytes of porcine mammary gland across development
- PMID: 37805503
- PMCID: PMC10560433
- DOI: 10.1186/s40104-023-00926-0
A cell transcriptomic profile provides insights into adipocytes of porcine mammary gland across development
Abstract
Background: Studying the composition and developmental mechanisms in mammary gland is crucial for healthy growth of newborns. The mammary gland is inherently heterogeneous, and its physiological function dependents on the gene expression of multiple cell types. Most studies focused on epithelial cells, disregarding the role of neighboring adipocytes.
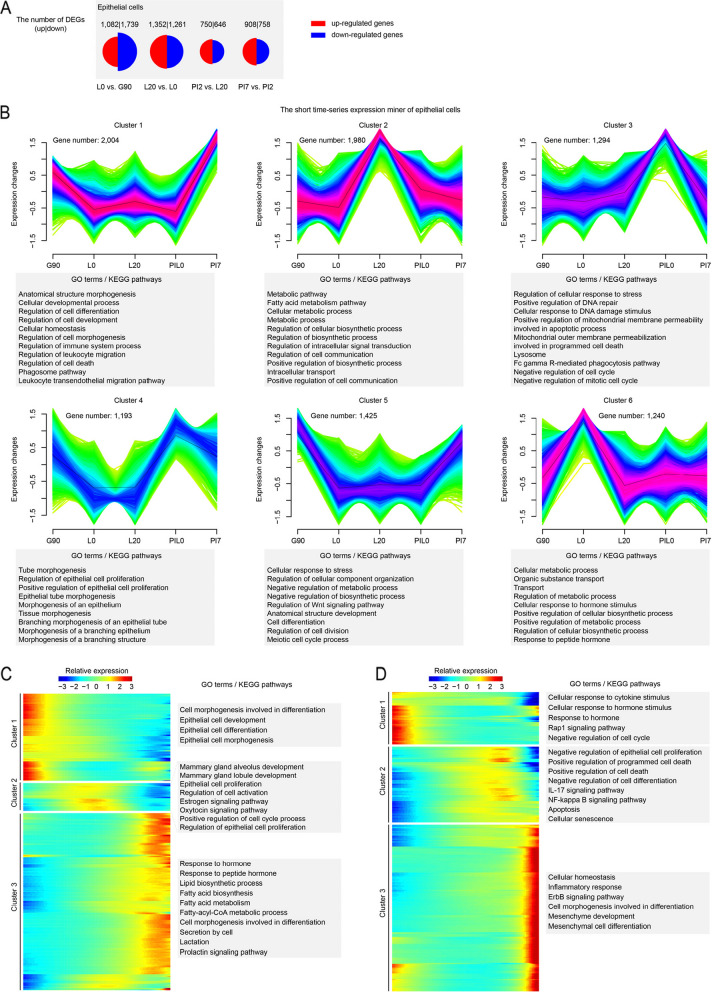
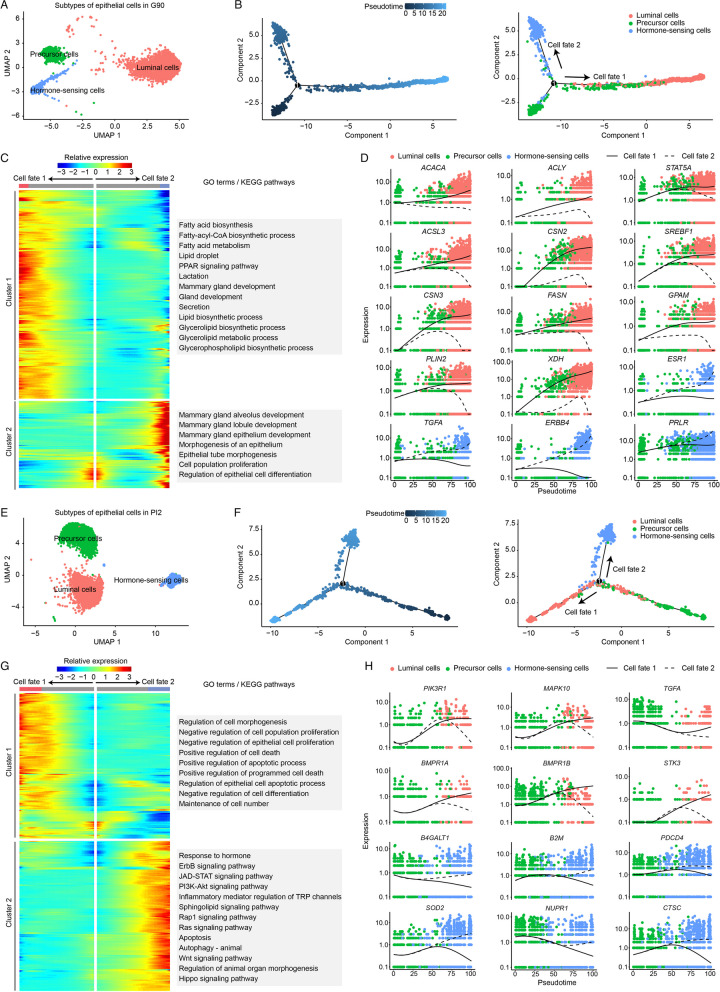
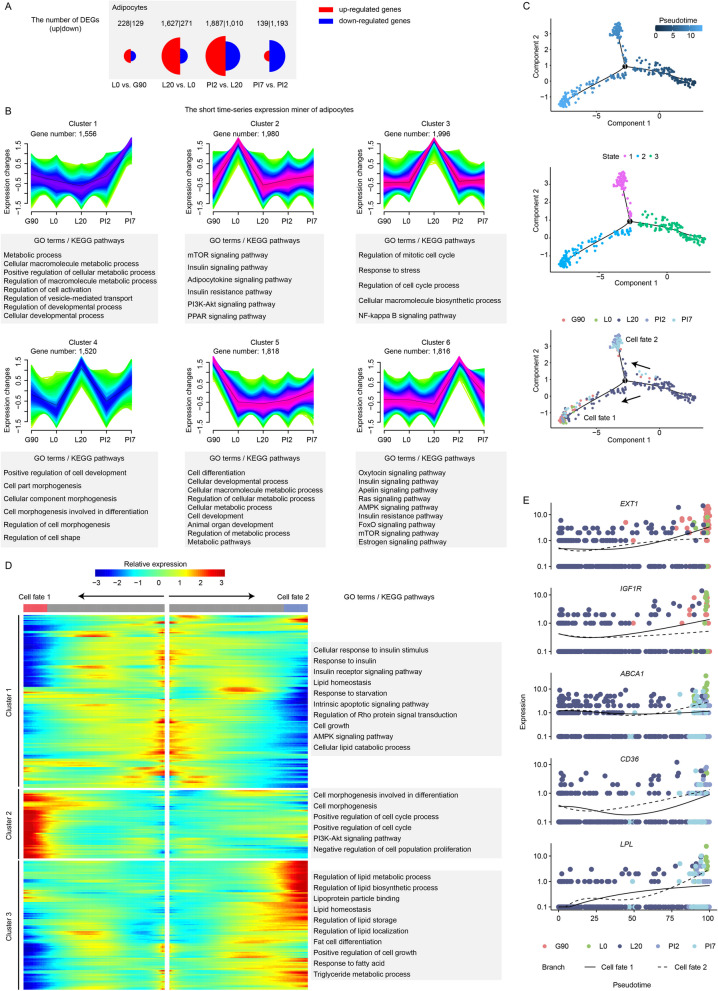
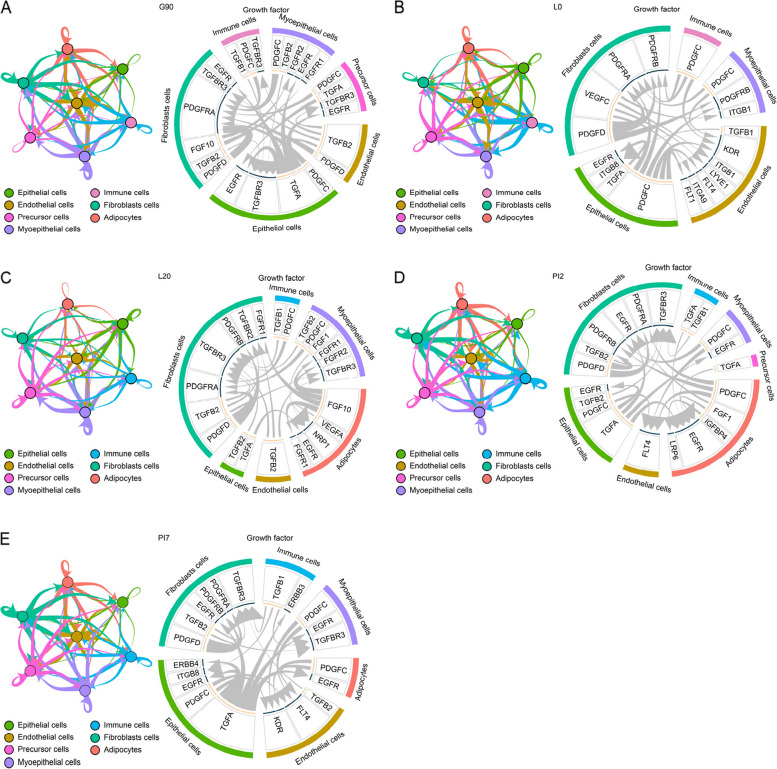
Results: Here, we constructed the largest transcriptomic dataset of porcine mammary gland cells thus far. The dataset captured 126,829 high-quality nuclei from physiological mammary glands across five developmental stages (d 90 of gestation, G90; d 0 after lactation, L0; d 20 after lactation, L20; 2 d post natural involution, PI2; 7 d post natural involution, PI7). Seven cell types were identified, including epithelial cells, adipocytes, endothelial cells, fibroblasts cells, immune cells, myoepithelial cells and precursor cells. Our data indicate that mammary glands at different developmental stages have distinct phenotypic and transcriptional signatures. During late gestation (G90), the differentiation and proliferation of adipocytes were inhibited. Meanwhile, partly epithelial cells were completely differentiated. Pseudo-time analysis showed that epithelial cells undergo three stages to achieve lactation, including cellular differentiation, hormone sensing, and metabolic activation. During lactation (L0 and L20), adipocytes area accounts for less than 0.5% of mammary glands. To maintain their own survival, the adipocyte exhibited a poorly differentiated state and a proliferative capacity. Epithelial cells initiate lactation upon hormonal stimulation. After fulfilling lactation mission, their undergo physiological death under high intensity lactation. Interestingly, the physiological dead cells seem to be actively cleared by immune cells via CCL21-ACKR4 pathway. This biological process may be an important mechanism for maintaining homeostasis of the mammary gland. During natural involution (PI2 and PI7), epithelial cell populations dedifferentiate into mesenchymal stem cells to maintain the lactation potential of mammary glands for the next lactation cycle.
Conclusion: The molecular mechanisms of dedifferentiation, proliferation and redifferentiation of adipocytes and epithelial cells were revealed from late pregnancy to natural involution. This cell transcriptomic profile constitutes an essential reference for future studies in the development and remodeling of the mammary gland at different stages.
Keywords: Adipocytes; Cell–cell interaction; Development; Mammary gland; snRNA-seq.
© 2023. Chinese Association of Animal Science and Veterinary Medicine.
Conflict of interest statement
The authors declare that they have no competing interests.
Figures


Similar articles
-
Transcriptome profiling of the nonlactating mammary glands of dairy goats reveals the molecular genetic mechanism of mammary cell remodeling.J Dairy Sci. 2022 Jun;105(6):5238-5260. doi: 10.3168/jds.2021-21039. Epub 2022 Mar 26. J Dairy Sci. 2022. PMID: 35346464
-
Remodeling of Murine Mammary Adipose Tissue during Pregnancy, Lactation, and Involution.J Mammary Gland Biol Neoplasia. 2019 Sep;24(3):207-212. doi: 10.1007/s10911-019-09434-2. Epub 2019 Sep 12. J Mammary Gland Biol Neoplasia. 2019. PMID: 31512027 Free PMC article. Review.
-
Characterization of long noncoding RNA in nonlactating goat mammary glands reveals their regulatory role in mammary cell involution and remodeling.Int J Biol Macromol. 2022 Dec 1;222(Pt B):2158-2175. doi: 10.1016/j.ijbiomac.2022.09.291. Epub 2022 Oct 6. Int J Biol Macromol. 2022. PMID: 36209911
-
Transcriptomic analysis of mammary gland tissues in lactating and non-lactating dairy goats reveals miRNA-mediated regulation of lactation, involution, and remodeling.Front Cell Dev Biol. 2025 May 30;13:1604855. doi: 10.3389/fcell.2025.1604855. eCollection 2025. Front Cell Dev Biol. 2025. PMID: 40519264 Free PMC article.
-
Mammary gland adipocytes in lactation cycle, obesity and breast cancer.Rev Endocr Metab Disord. 2021 Jun;22(2):241-255. doi: 10.1007/s11154-021-09633-5. Epub 2021 Mar 22. Rev Endocr Metab Disord. 2021. PMID: 33751362 Free PMC article. Review.
Cited by
-
Advancements in the Application of scRNA-Seq in Breast Research: A Review.Int J Mol Sci. 2024 Dec 22;25(24):13706. doi: 10.3390/ijms252413706. Int J Mol Sci. 2024. PMID: 39769466 Free PMC article. Review.
-
Insights into the molecular changes of adipocyte dedifferentiation and its future research opportunities.J Lipid Res. 2024 Nov;65(11):100644. doi: 10.1016/j.jlr.2024.100644. Epub 2024 Sep 18. J Lipid Res. 2024. PMID: 39303983 Free PMC article. Review.
-
Polymorphisms of ITGA9 Gene and Their Correlation with Milk Quality Traits in Yak (Bos grunniens).Foods. 2024 May 22;13(11):1613. doi: 10.3390/foods13111613. Foods. 2024. PMID: 38890842 Free PMC article.
-
Instant fluorescence lifetime imaging microscopy reveals mechano-metabolic reprogramming of stromal cells in breast cancer peritumoral microenvironments.bioRxiv [Preprint]. 2025 May 30:2025.05.28.656717. doi: 10.1101/2025.05.28.656717. bioRxiv. 2025. PMID: 40501613 Free PMC article. Preprint.
-
The rat mammary gland undergoes dynamic transcriptomic and lipidomic modifications from pre-puberty to adulthood.Sci Rep. 2025 Apr 10;15(1):12222. doi: 10.1038/s41598-025-97532-z. Sci Rep. 2025. PMID: 40210913 Free PMC article.
References
Grants and funding
LinkOut - more resources
Full Text Sources
Molecular Biology Databases
Miscellaneous
