

PandaGUT provides new insights into bacterial diversity, function, and resistome landscapes with implications for conservation
- PMID: 37805557
- PMCID: PMC10559513
- DOI: 10.1186/s40168-023-01657-0
PandaGUT provides new insights into bacterial diversity, function, and resistome landscapes with implications for conservation
Abstract
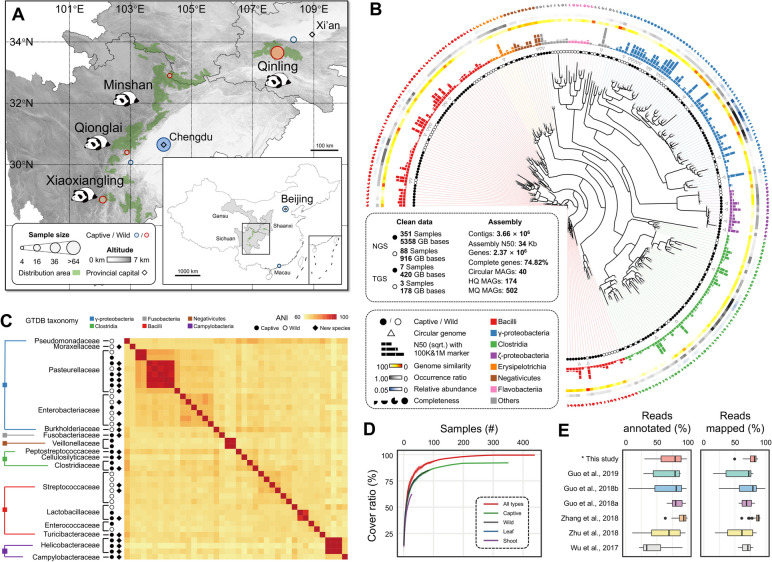
Background: The gut microbiota play important roles in host adaptation and evolution, but are understudied in natural population of wild mammals. To address host adaptive evolution and improve conservation efforts of threatened mammals from a metagenomic perspective, we established a high-quality gut microbiome catalog of the giant panda (pandaGUT) to resolve the microbiome diversity, functional, and resistome landscapes using approximately 7 Tbp of long- and short-read sequencing data from 439 stool samples.
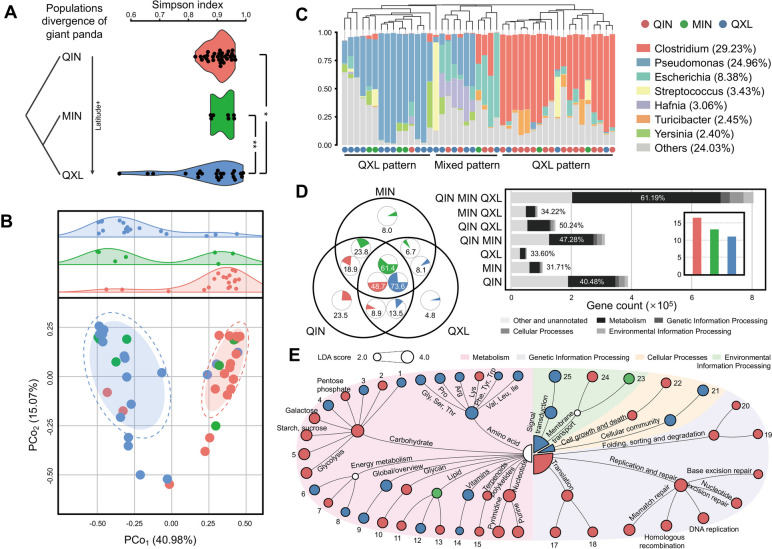
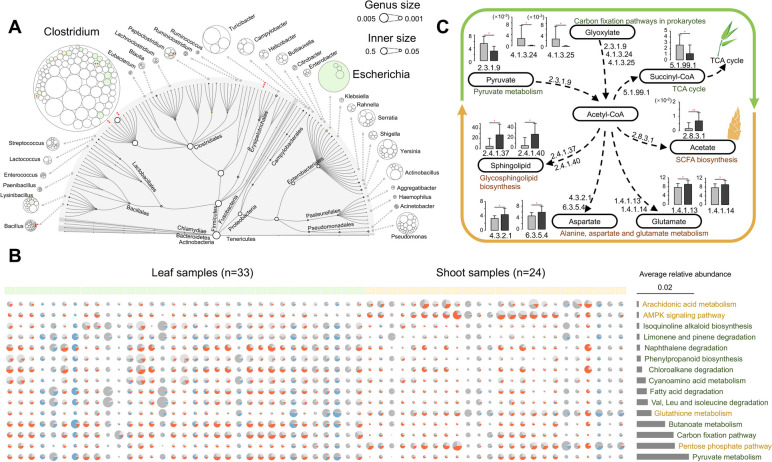
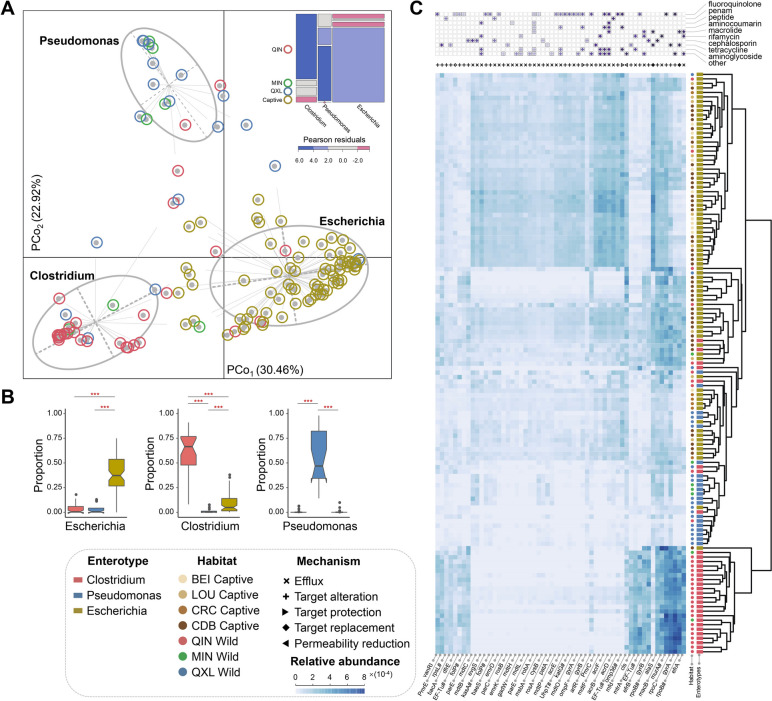
Results: The pandaGUT catalog comprises 820 metagenome-assembled genomes, including 40 complete closed genomes, and 64.5% of which belong to species that have not been previously reported, greatly expanding the coverage of most prokaryotic lineages. The catalog contains 2.37 million unique genes, with 74.8% possessing complete open read frames, facilitating future mining of microbial functional potential. We identified three microbial enterotypes across wild and captive panda populations characterized by Clostridium, Pseudomonas, and Escherichia, respectively. We found that wild pandas exhibited host genetic-specific microbial structures and functions, suggesting host-gut microbiota phylosymbiosis, while the captive cohorts encoded more multi-drug resistance genes.
Conclusions: Our study provides largely untapped resources for biochemical and biotechnological applications as well as potential intervention avenues via the rational manipulation of microbial diversity and reducing antibiotic usage for future conservation management of wildlife. Video Abstract.
Keywords: Adaptive evolution; Conservation; Diversity; Giant panda; Gut microbiome; Wild mammal.
© 2023. BioMed Central Ltd., part of Springer Nature.
Conflict of interest statement
The authors declare no competing interests.
Figures
Similar articles
-
Reference gene catalog and metagenome-assembled genomes from the gut microbiome reveal the microbial composition, antibiotic resistome, and adaptability of a lignocellulose diet in the giant panda.Environ Res. 2024 Mar 15;245:118090. doi: 10.1016/j.envres.2023.118090. Epub 2023 Dec 30. Environ Res. 2024. PMID: 38163545
-
Comparative Study of Gut Microbiota in Wild and Captive Giant Pandas (Ailuropoda melanoleuca).Genes (Basel). 2019 Oct 20;10(10):827. doi: 10.3390/genes10100827. Genes (Basel). 2019. PMID: 31635158 Free PMC article.
-
Metagenome-assembled genomes and gene catalog from the chicken gut microbiome aid in deciphering antibiotic resistomes.Commun Biol. 2021 Nov 18;4(1):1305. doi: 10.1038/s42003-021-02827-2. Commun Biol. 2021. PMID: 34795385 Free PMC article.
-
Global landscape of gut microbiome diversity and antibiotic resistomes across vertebrates.Sci Total Environ. 2022 Sep 10;838(Pt 2):156178. doi: 10.1016/j.scitotenv.2022.156178. Epub 2022 May 23. Sci Total Environ. 2022. PMID: 35618126 Review.
-
Conservation metagenomics: a new branch of conservation biology.Sci China Life Sci. 2019 Feb;62(2):168-178. doi: 10.1007/s11427-018-9423-3. Epub 2018 Dec 25. Sci China Life Sci. 2019. PMID: 30588567 Review.
Cited by
-
Gut bacterial and fungal communities of François' langur (Trachypithecus francoisi) changed coordinate to different seasons.Front Microbiol. 2025 Mar 5;16:1547955. doi: 10.3389/fmicb.2025.1547955. eCollection 2025. Front Microbiol. 2025. PMID: 40109980 Free PMC article.
-
Editorial: Community series in the wildlife gut microbiome and its implication for conservation biology, volume II.Front Microbiol. 2023 Dec 20;14:1329928. doi: 10.3389/fmicb.2023.1329928. eCollection 2023. Front Microbiol. 2023. PMID: 38173679 Free PMC article. No abstract available.
-
Comparative Analysis of Gut Microbiome Community Structures in Different Populations of Asian Elephants in China and Their Correlation with Diet.Genes (Basel). 2025 Apr 25;16(5):483. doi: 10.3390/genes16050483. Genes (Basel). 2025. PMID: 40428305 Free PMC article.
-
Adaptive changes in the intestinal microbiota of giant pandas following reintroduction.Sci Rep. 2025 Aug 23;15(1):31014. doi: 10.1038/s41598-025-16136-9. Sci Rep. 2025. PMID: 40849504
-
Updating conservation metagenomics on the gut microbiome of threatened mammals.iScience. 2025 Jun 25;28(7):113000. doi: 10.1016/j.isci.2025.113000. eCollection 2025 Jul 18. iScience. 2025. PMID: 40687781 Free PMC article. Review.
References
Publication types
MeSH terms
LinkOut - more resources
Full Text Sources
