. 2023 Oct 7;14(1):6270.
doi: 10.1038/s41467-023-41925-z.

Integrin signaling is critical for myeloid-mediated support of T-cell acute lymphoblastic leukemia

Affiliations

Integrin signaling is critical for myeloid-mediated support of T-cell acute lymphoblastic leukemia

Aram Lyu et al. Nat Commun. .

Abstract

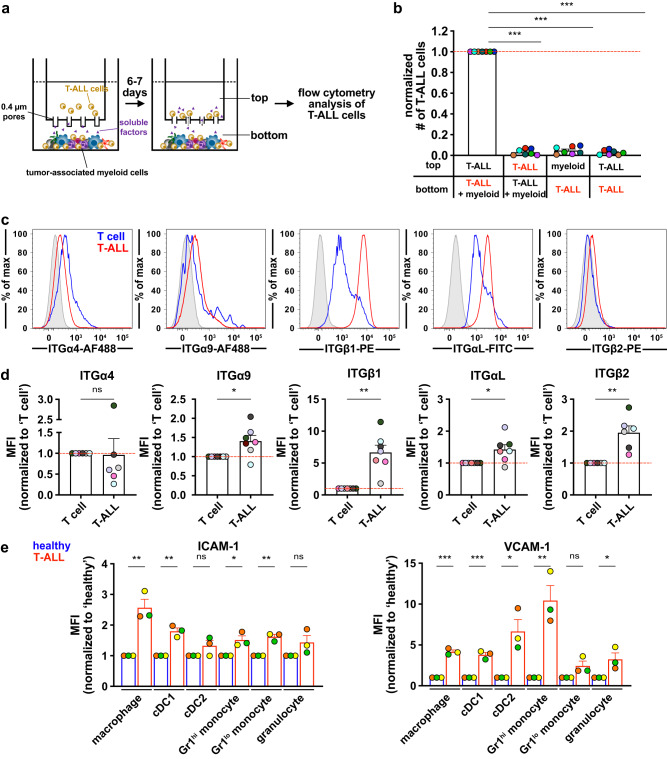
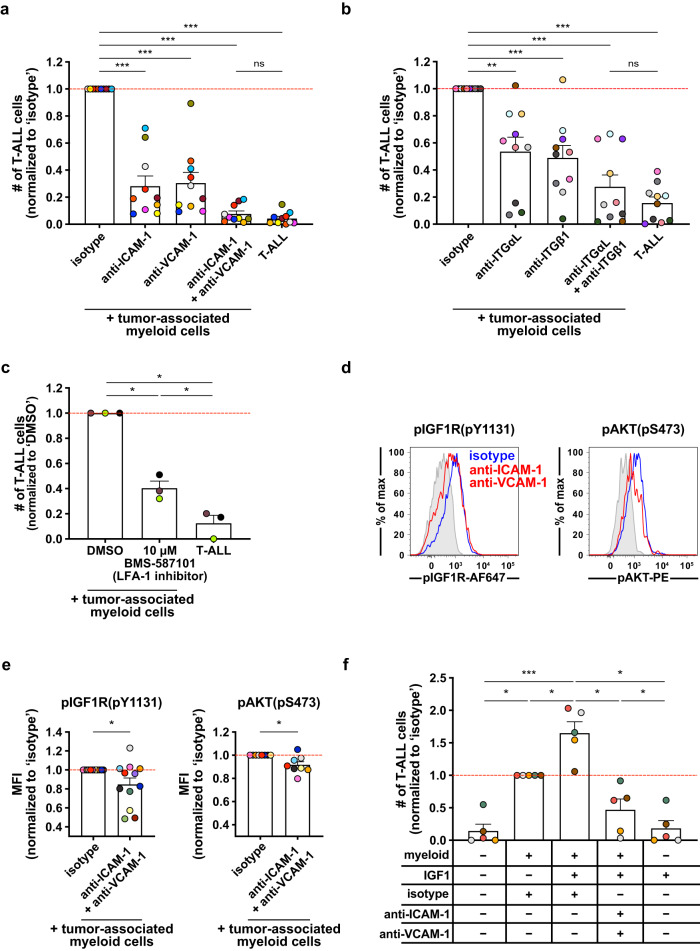
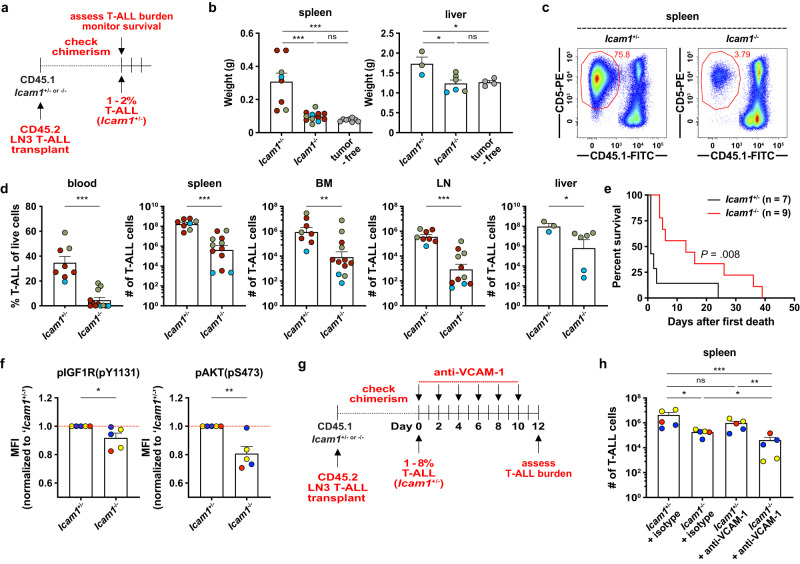
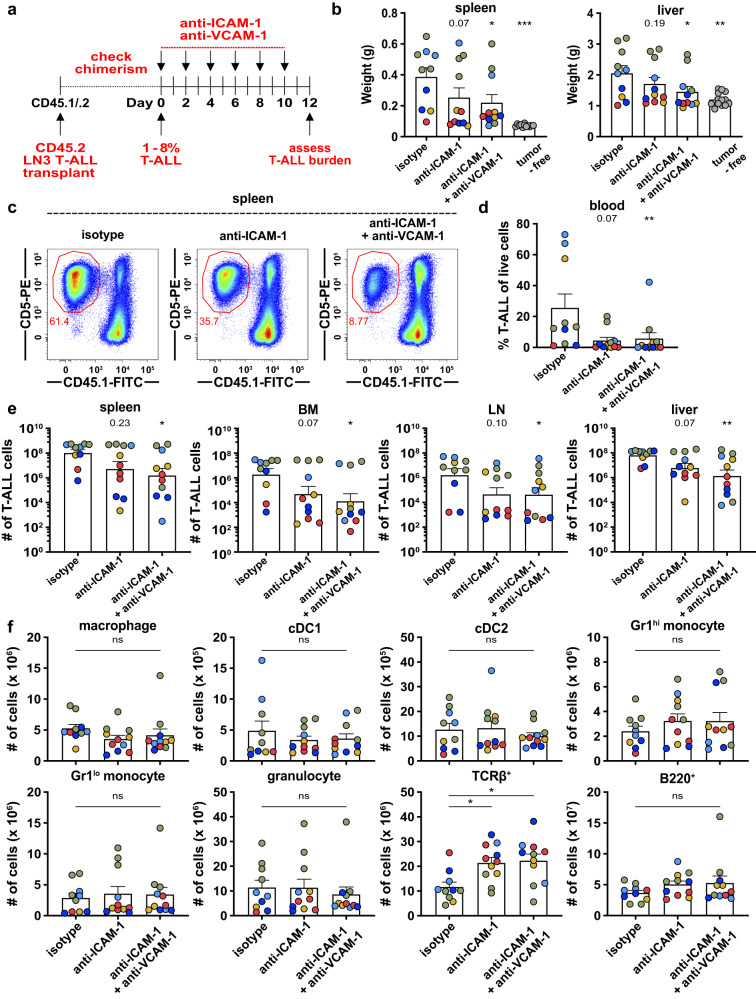
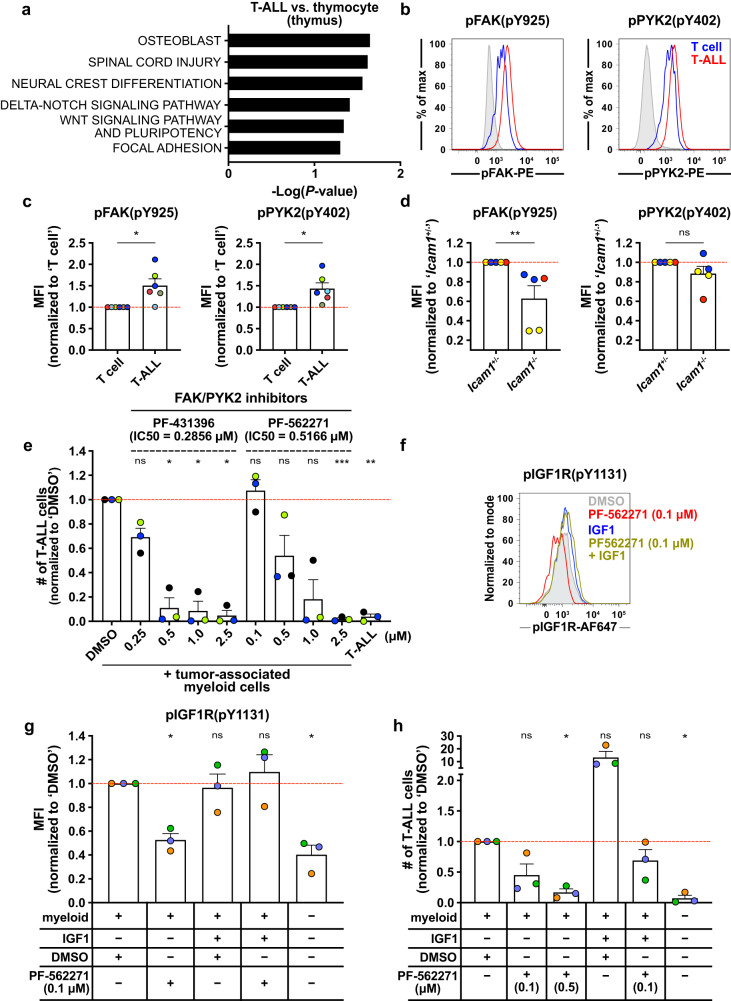
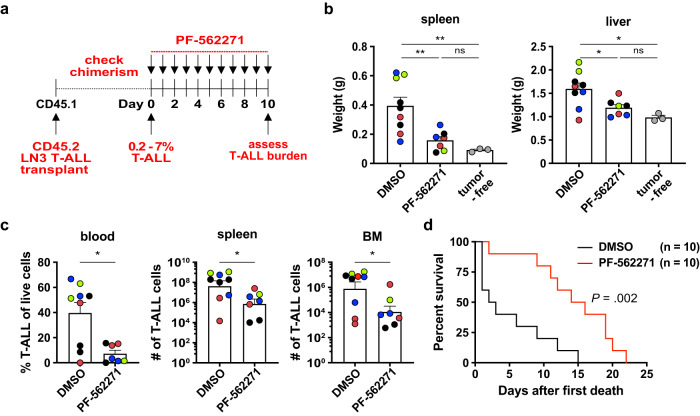
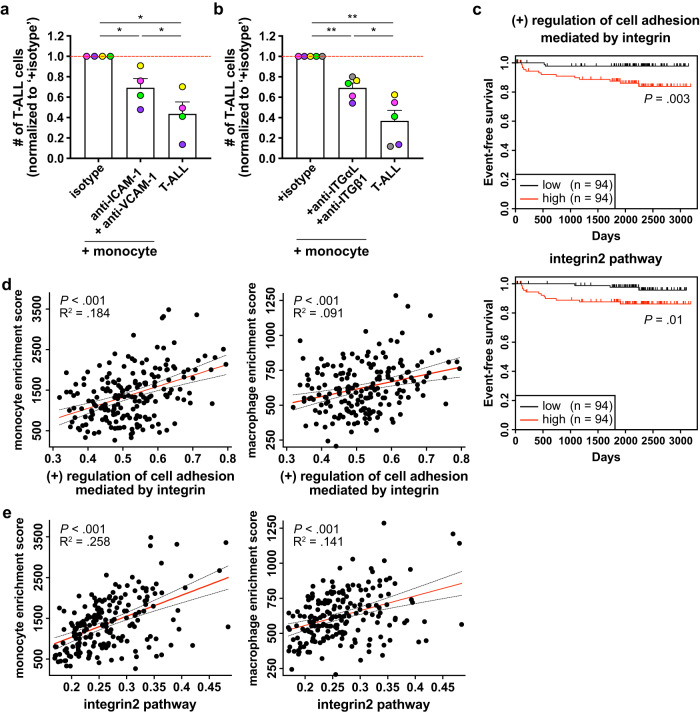
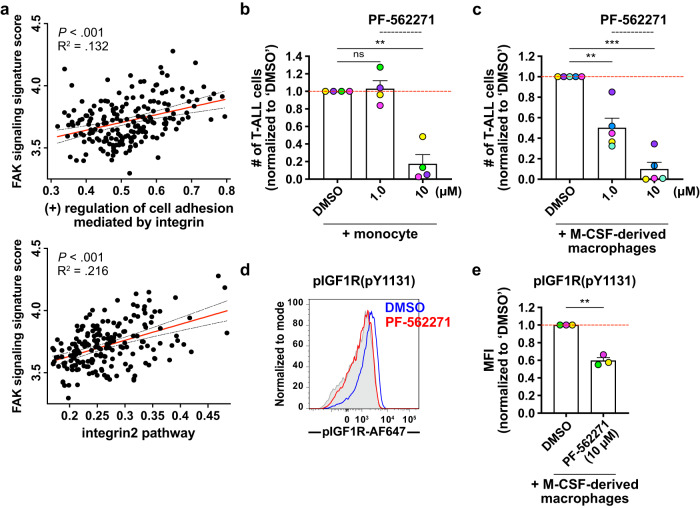
We previously found that T-cell acute lymphoblastic leukemia (T-ALL) requires support from tumor-associated myeloid cells, which activate Insulin Like Growth Factor 1 Receptor (IGF1R) signaling in leukemic blasts. However, IGF1 is not sufficient to sustain T-ALL in vitro, implicating additional myeloid-mediated signals in leukemia progression. Here, we find that T-ALL cells require close contact with myeloid cells to survive. Transcriptional profiling and in vitro assays demonstrate that integrin-mediated cell adhesion activates downstream focal adhesion kinase (FAK)/ proline-rich tyrosine kinase 2 (PYK2), which are required for myeloid-mediated T-ALL support, partly through activation of IGF1R. Blocking integrin ligands or inhibiting FAK/PYK2 signaling diminishes leukemia burden in multiple organs and confers a survival advantage in a mouse model of T-ALL. Inhibiting integrin-mediated adhesion or FAK/PYK2 also reduces survival of primary patient T-ALL cells co-cultured with myeloid cells. Furthermore, elevated integrin pathway gene signatures correlate with higher FAK signaling and myeloid gene signatures and are associated with an inferior prognosis in pediatric T-ALL patients. Together, these findings demonstrate that integrin activation and downstream FAK/PYK2 signaling are important mechanisms underlying myeloid-mediated support of T-ALL progression.


Conflict of interest statement

The authors declare no competing interests.

Figures

Fig. 1
Fig. 1. Close contact is critical for myeloid-mediated T-ALL survival, and integrin expression is elevated on T-ALL cells.
a Schematic illustration of transwell assays in which LN3 T-ALL cells are cultured in the presence or absence of enriched tumor-associated myeloid cells in the same or opposite chambers to determine whether T-ALL cells require close contact with myeloid cells to survive. b Quantification of viable T-ALL cells in the chamber indicated in red 6–7 days after co-culture initiation. Results were normalized to the viability of T-ALL cells making physical contact with tumor-associated myeloid cells in the bottom chamber within each experiment. Bars depict the mean + SEM of cumulative data from n = 7 experiments, each with a distinct color-coded primary T-ALL; symbols represent the mean of 2-3 replicate wells per experiment. c Representative flow cytometry plots and (d) quantification ofcell surface integrin expression levels of transplanted LN3 T-ALL cells (red; CD45.2+CD5+) and host T cells (blue; CD45.1+CD5+) from the same leukemic spleens, quantified as median fluorescence intensity (MFI) values by flow cytometry. Isotype control stains are shaded in gray. d Results were normalized to T-cell levels within each experiment. Data are compiled from n = 6 (ITGα4, ITGβ2) or 7 (ITGα9, ITGβ1, ITGαL) independent experiments, each with a distinct color-coded primary T-ALL; symbols represent individual mice. e Quantification of ICAM-1 (left) and VCAM-1 (right) protein levels on the indicated myeloid subsets from the spleens of healthy (blue) or leukemic (red) mice. Results were normalized to healthy controls within each subset. Bars depict the mean + SEM of cumulative data from n = 3 experiments, each with a distinct color-coded primary T-ALL; symbols represent individual mice. Statistical significance was determined by (b) a two-sided repeated measures one-way ANOVA with the Holm-Sidak correction, (d) two-sided paired Student t-tests, and (e) two-sided unpaired Student t-tests; P-values: *<0.05, **<0.01, ***<0.001. ns, not significant. Source data are provided as a Source Data file.
Fig. 2
Fig. 2. Integrin-mediated cell adhesion is required for myeloid support of T-ALL survival in vitro and for sensitization of T-ALL cells to IGF1R signaling.
a, b Quantification of viable splenic LN3 T-ALL cells 6–7 days after co-culture with tumor-associated myeloid cells in the presence of (a) anti-ICAM-1 and/or anti-VCAM-1 blocking antibodies or (b) anti-integrin αL (ITGαL) and/or anti-ITGβ1 blocking antibodies (10 µg/ml for each). Results were normalized to isotype-treated cultures. Bars show mean + SEM from n = 10 independent experiments, with distinct color-coded primary T-ALL; symbols represent averages of 2-3 technical replicate wells. Red lines indicate normalized mean viability of isotype-treated T-ALL cells. c Quantification of viable splenic LN3 T-ALL cells 6–7 days after co-culture with tumor-associated myeloid cells +/- 10 µM BMS-587101 (LFA-1 inhibitor) or DMSO control. Results were normalized to DMSO-treated cultures. Bars show mean + SEM from n = 3 independent experiments, with distinct color-coded primary T-ALL; symbols represent averages of 2–3 technical replicate wells. The red line indicates normalized mean viability of DMSO-treated T-ALL. d, e (d) Representative flow cytometry plots and  (e) quantification of phosphorylated (p)IGF1R and pAKT in LN3 T-ALL cells co-cultured with tumor-associated myeloid cells for 4–5 days with anti-ICAM-1 and anti-VCAM-1 blocking antibodies (red in (d); 10 µg/ml each) or isotype controls (blue in (d)). Isotype control stains are shaded in gray in (d). Results in (e) were normalized to the MFI of isotype-treated cultures in each experiment. Bars represent mean + SEM from n = 8 (pAKT) or n = 12 (pIGF1R) independent experiments, each with a distinct color-coded primary T-ALL. Red lines indicate normalized mean MFIs of isotype-treated cultures. f Quantification of viable splenic T-ALL cells 6–7 days after co-culture with enriched tumor-associated myeloid cells +/- exogenous IGF1 (100 ng/ml) +/- anti-ICAM-1 and anti-VCAM-1 blocking antibodies (10 µg/ml each). Results were normalized to T-ALL-myeloid co-cultures with isotype control antibodies. Bars represent mean + SEM from n = 5 independent experiments with distinct color-coded primary T-ALL; symbols represent averages of 2-3 technical replicate wells. The red line indicates the normalized mean viability of isotype-treated co-cultures. Statistical significance was determined by (a, b, c, f) a two-sided repeated measures one-way ANOVA with the Holm-Sidak correction, and (e) two-sided paired Student t-tests; P-values: *<0.05, **<0.01, ***<0.001. ns, not significant. Source data are provided as a Source Data file.
Fig. 3
Fig. 3. ICAM-1- and VCAM-1-mediated cell adhesion is critical for T-ALL establishment and/or progression in vivo.
a Schematic of experiment to test if T-ALL burden or mouse survival are impacted by Icam1 deficiency. b Quantification of splenic and liver weights of Icam1+/- and Icam1-/- mice transplanted with primary LN3 T-ALL or tumor-free littermates. Results were compiled from n = 2 (liver) or 3 (spleen) experiments, each with a distinct color-coded primary T-ALL; symbols represent individual mice. c Representative flow cytometry plots showing diminished splenic T-ALL burden in LN3 T-ALL-bearing Icam1-/- versus Icam1+/- littermates. d Quantification of the frequency of circulating T-ALL blasts or the number of T-ALL cells in spleen, bone marrow (BM), inguinal lymph nodes (LN), and liver in Icam1+/- and Icam1-/- mice from the experiments in (b). e Cumulative survival of Icam1+/- and Icam1-/- leukemic mice from n = 3 independent experiments, each with a different primary LN3 T-ALL, using the strategy in (a). Kaplan–Meier survival curves were normalized to the first day of death in each experiment. f Quantification of pIGF1R and pAKT expression in splenic T-ALL cells from Icam1+/- and Icam1-/- mice treated with an isotype control antibody from the experiments in Supplementary Fig. 7b, c. Results were normalized to the MFI of Icam1+/- mice within each experiment and were compiled from n = 3 independent experiments, each with a distinct color-coded primary T-ALL; symbols represent individual mice. Red lines indicate normalized mean MFIs from Icam1+/- mice. g Experimental schematic depicting dosing schedule for anti-VCAM-1 or isotype control antibodies following establishment of LN3 T-ALL (1–8% spleen chimerism) in Icam1-/- and Icam1+/- mice. Leukemia burden was assessed 2 days after the final antibody injection. h Quantification of T-ALL cells in the spleens of Icam1+/- and Icam1-/- mice treated with either anti-VCAM-1 or isotype control antibodies. Results were compiled from n = 3 experiments, each with a distinct color-coded primary T-ALL; symbols represent individual mice. Throughout this figure, bars depict means + SEM of cumulative data. Statistical significance was determined by (b, h) a two-sided repeated measures one-way ANOVA with the Holm-Sidak correction, (d, f) two-sided unpaired Student t-tests, and (e) log-rank tests; P-values: *<0.05, **<0.01, ***<0.001. ns, not significant. Source data are provided as a Source Data file.
Fig. 4
Fig. 4. Inhibition of ICAM-1- and VCAM-1-mediated cell adhesion reduces T-ALL burden in vivo.
a Experimental schematic depicting dosing schedule for anti-ICAM-1, anti-VCAM-1, or isotype control antibodies following establishment of LN3 T-ALL ( > 1% spleen chimerism) in congenic hosts. Leukemia burden was assessed 2 days after the final antibody injection. b Quantification of spleen and liver weights from the experiments depicted in (a). Tumor-free, age-matched mice were included for comparison. Bars depict the mean + SEM of cumulative data from n = 5 experiments, each with a distinct color-coded primary T-ALL; symbols represent individual mice. c Representative flow cytometry plots showing a decrease in T-ALL burden in the spleens of LN3 T-ALL-transplanted mice following treatment with anti-ICAM-1 +/- anti-VCAM-1 antibodies (100 µg each per mouse). d, e Quantification of the (d) frequency of circulating T-ALL blasts in the blood and (e) number of T-ALL cells in the spleen, BM, LN, and liver from the same experiments as in (b). f Quantification of the indicated myeloid subsets or TCRβ+ or B220+ host cells in the spleens of mice from the same experiments as in (d, e). Statistical significance was determined by (b, d, e, f) a two-sided repeated measures one-way ANOVA with the Holm-Sidak correction; P-values: *<0.05, **<0.01, ***<0.001. ns, not significant. Source data are provided as a Source Data file.
Fig. 5
Fig. 5. Inhibition of FAK and PYK2 signaling reduces T-ALL survival in vitro.
a The top 6 pathways upregulated in thymic T-ALL cells versus healthy thymocytes identified using Enrichr with WikiPathways 2019 Mouse gene sets. b, c (b) Representative flow cytometry plots and (c) quantification of pFAK and pPYK2 levels in T-ALL (CD45.2+CD5+) relative to host T cells (CD45.1+CD5+) in the same leukemic spleens. Isotype control stain in gray. Results were normalized to mean MFIs of T cells and compiled from n = 6 independent experiments. d Quantification of pFAK and pPYK2 levels in splenic LN3 T-ALL from Icam1+/- and Icam1-/- hosts treated with an isotype control antibody from experiments in Supplementary Fig. 7b, c. Results were normalized to the MFI of Icam1+/- mice and compiled from n = 3 independent experiments; symbols represent individual mice. e Quantification of viable T-ALL cells in myeloid co-cultures treated 4 days after culture initiation with FAK/PYK2 dual inhibitors (PF-431396 or PF-562271) and quantified 2–3 days later. Results were normalized to DMSO treated control cultures and compiled from n = 3 independent experiments; symbols represent averages of 2–3 replicate wells. f, g (f) Representative flow cytometry plots and (g) quantification of pIGF1R levels in LN3 T-ALL cells co-cultured with myeloid cells and PF-562271 (0.1 μM) and/or IGF1 (100 ng/ml), or DMSO for 4–5 days. Results were normalized to DMSO-treated cultures and compiled from n = 3 independent experiments; symbols represent averages of 2-3 technical replicate wells. h Quantification of viable splenic T-ALL cells 4–5 days after co-culture with enriched myeloid cells +/- exogenous IGF1 (100 ng/ml) and/or PF-562271 (0.1 or 0.5 μM, as indicated). Results were normalized to T-ALL cells co-cultured with myeloid cells + DMSO alone and compiled from n = 3 independent experiments; symbols represent the average of 2-3 technical replicate wells per experiment. Bars represent means + SEM; red lines indicate normalized means of controls. Distinct primary T-ALLs are color-coded. Statistical significance was determined by (a) Fisher exact tests, (c) two-sided paired Student t-tests, (d) two-sided unpaired Student t-tests, and (e, g, h) a two-sided repeated measures one-way ANOVA with the Holm-Sidak correction: *<0.05, **<0.01, ***<0.001. ns, not significant. Source data are provided as a Source Data file.
Fig. 6
Fig. 6. FAK and PYK2 are critical for T-ALL survival and progression in vivo.
a Experimental schematic depicting dosing schedule for PF-562271 or DMSO vehicle control treatment to inhibit FAK and PYK2 signaling in mice following establishment of LN3 T-ALL in congenic recipients (>0.2% spleen chimerism). b Quantification of spleen and liver weights from mice transplanted with primary LN3 T-ALL after treatment with PF-562271 or DMSO, as in (a). Tumor-free littermates were included for comparison. c Quantification of the frequency of circulating T-ALL blasts and the number of T-ALL cells in the spleen and BM from the same experiments as in (b). Bars depict the mean + SEM of cumulative data from n = 4 experiments, each with a distinct color-coded primary T-ALL; symbols represent individual mice. d Graph shows cumulative survival of PF-562271 or DMSO-treated leukemic mice from n = 3 independent experiments, each with a different primary LN3 T-ALL, using the strategy as in (a). Kaplan–Meier survival curves were normalized to the first day of death in each experiment. Statistical significance was determined by (b) a two-sided repeated measures one-way ANOVA with the Holm-Sidak correction, (c) two-sided unpaired Student t-tests, and (d) log-rank tests; P-values: *<0.05, **<0.01. ns not significant. Source data are provided as a Source Data file.
Fig. 7
Fig. 7. Human myeloid cells promote survival of primary patient T-ALL cells in an integrin-dependent manner in vitro, and enriched gene signatures of integrin pathways in patients are associated with worse prognosis.
a, b Quantification of viable primary patient T-ALL cells cultured for 6–7 days alone or with monocytes from healthy donor peripheral blood mononuclear cells (PBMCs). Co-cultures were carried out in the presence of (a) anti-ICAM-1 (20 µg/ml) and anti-VCAM-1 (10 µg/ml) blocking antibodies, (b) anti-integrin αL (ITGαL) and anti-ITGβ1 blocking antibodies (10 µg/ml for each), or isotype control antibodies as indicated. Results were normalized to isotype-treated cultures in each experiment. Bars represent means + SEM from n = 2–3 independent experiments using 4–5 distinct, color-coded patient-derived T-ALLs; symbols represent the average of 2 technical replicate wells. Red lines indicate the normalized mean T-ALL viability in isotype-treated cultures. c Longitudinal event-free survival is plotted for pediatric T-ALL patients stratified into two equal groups based on their gene signature enrichment scores for “(+) regulation of cell adhesion mediated by integrin” (top) or “integrin2 pathway” (bottom). Patient data were analyzed from published datasets from 264 T-ALL patients from the TARGET ALL Phase II trial. d, e Plots depict correlations between enrichment scores of the gene signatures (d) “(+) regulation of cell adhesion mediated by integrin” or (e) “integrin2 pathway” with enrichment scores for monocytes (left) and macrophages (right) in patient samples. The red and black dotted lines represent the best-fit line and 95% confidence bands, respectively. Symbols represent each patient. Statistical significance was determined by (a, b) a two-sided repeated measures one-way ANOVA with the Holm-Sidak correction, (c) log-rank tests, and (d, e) simple linear regression analyses; P-values: *<0.05, **<0.01. ns not significant. Source data are provided as a Source Data file.
Fig. 8
Fig. 8. FAK/PYK2 signaling is critical for primary patient T-ALL survival in vitro.
a Plots show the correlation between enrichment scores for the gene signatures “(+) regulation of cell adhesion mediated by integrin” (left) or “integrin2 pathway” (right) with signature scores of FAK signaling in patient samples from the TARGET ALL Phase II trial. The enrichment scores for “FAK signaling signature” were calculated using the gene signatures from a prior study. The red and black dotted lines represent the best-fit line and 95% confidence bands, respectively. Symbols represent each patient. b, c Quantification of viable primary patient T-ALL cells co-cultured for 4 days with (b) PBMC-derived monocytes or (c) M-CSF-derived macrophages 2–3 days after addition of the indicated concentrations of PF-562271 or vehicle control (DMSO). Results were normalized to DMSO-treated cultures for each experiment. Bars represent means + SEM from n = 3 independent experiments using 4-5 distinct, color-coded patient-derived T-ALLs; symbols represent the average of 2 technical replicate wells. Red lines indicate the normalized mean T-ALL viability in DMSO-treated cultures. d Representative flow cytometry plots of pIGF1R in primary patient T-ALL cells co-cultured with M-CSF-derived macrophages for 4 days before addition of 10 μM of PF-562271 (red) or vehicle control (DMSO; blue). pIGF1R levels were assessed after 1–2 days. Isotype control stains are shaded in gray. e Quantification of pIGF1R MFI levels in co-cultured T-ALL cells, as in (d). Results were normalized to the MFI of DMSO-treated cultures within each experiment. Bars represent mean + SEM from n = 3 independent experiments, each with a distinct color-coded primary T-ALL; symbols represent the average of 2–3 technical replicate wells. The red line indicates the normalized mean MFI of DMSO-treated cultures. Statistical significance was determined by (a) simple linear regression analyses, (b, c) a two-sided repeated measures one-way ANOVA with the Holm-Sidak correction, and (e) two-sided paired Student t-tests; P-values: **<0.01, ***<0.001. ns not significant. Source data are provided as a Source Data file.

References

    1. Vadillo E, Dorantes-Acosta E, Pelayo R, Schnoor M. T cell acute lymphoblastic leukemia (T-ALL): new insights into the cellular origins and infiltration mechanisms common and unique among hematologic malignancies. Blood Rev. 2018;32:36–51. - PubMed
    1. Hunger SP, Mullighan CG. Acute lymphoblastic leukemia in children. N. Engl. J. Med. 2015;373:1541–1552. - PubMed
    1. Möricke A, et al. Dexamethasone vs prednisone in induction treatment of pediatric ALL: results of the randomized trial AIEOP-BFM ALL 2000. Blood. 2016;127:2101–2112. - PubMed
    1. Cordó V, et al. T-cell Acute Lymphoblastic Leukemia: a roadmap to targeted therapies. Blood Cancer Discov. 2020;2:19–31. - PMC - PubMed
    1. Luskin MR, et al. Nelarabine, cyclosphosphamide and etoposide for adults with relapsed T‐cell acute lymphoblastic leukaemia and lymphoma. Brit. J. Haematol. 2016;174:332–334. - PubMed

Publication types

MeSH terms