. 2023 Oct 7;7(1):53.
doi: 10.1038/s41538-023-00228-9.

Effects of sodium nitrite reduction, removal or replacement on cured and cooked meat for microbiological growth, food safety, colon ecosystem, and colorectal carcinogenesis in Fischer 344 rats

Affiliations

Effects of sodium nitrite reduction, removal or replacement on cured and cooked meat for microbiological growth, food safety, colon ecosystem, and colorectal carcinogenesis in Fischer 344 rats

Françoise Guéraud et al. NPJ Sci Food. .

Abstract

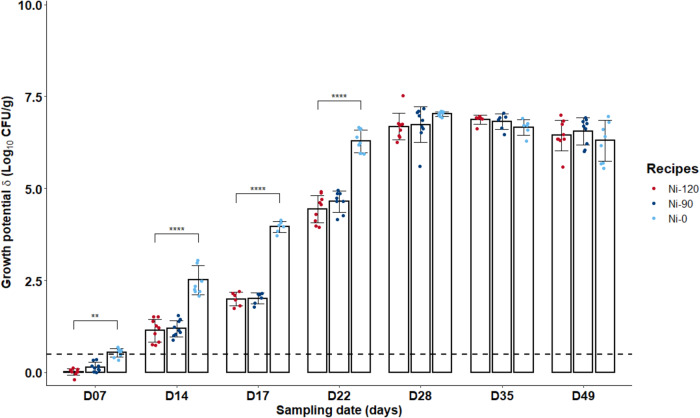
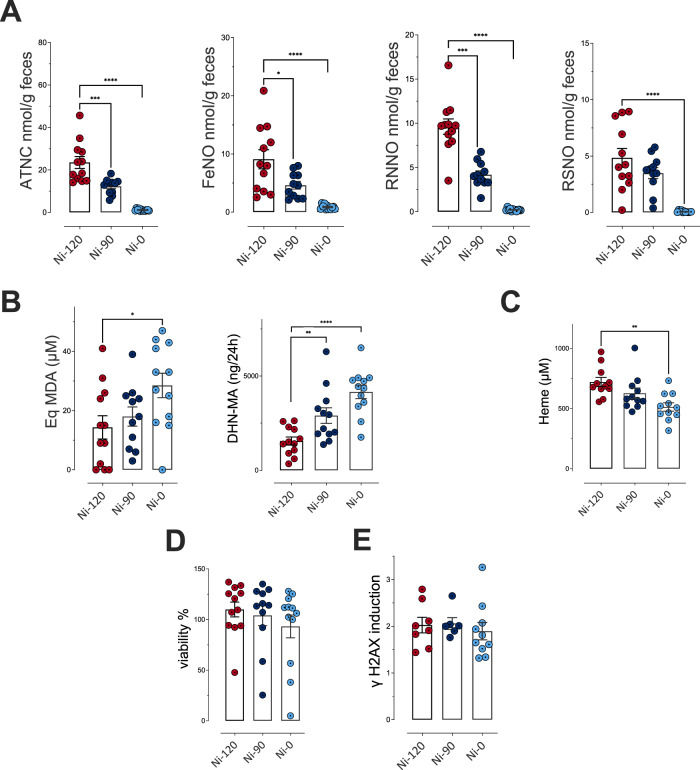
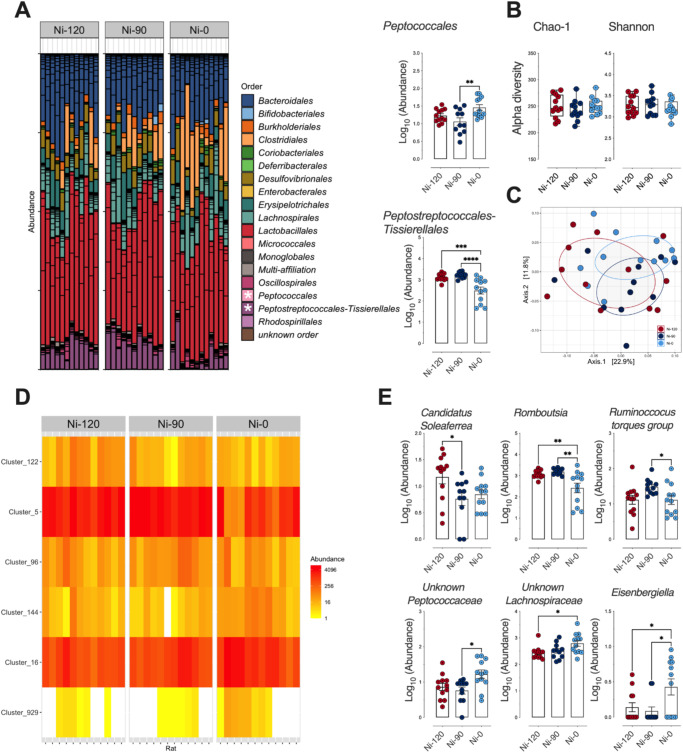
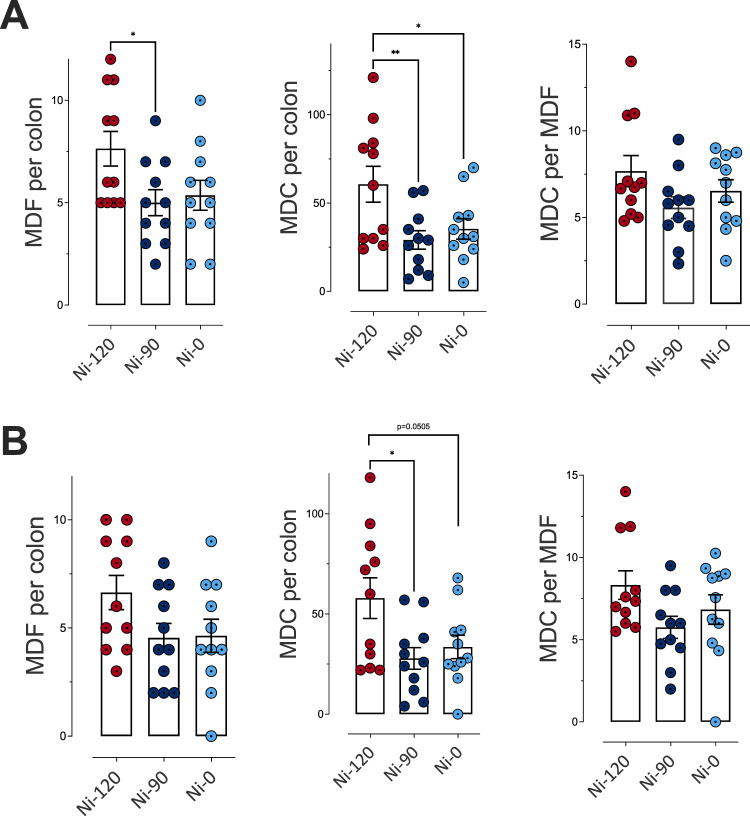
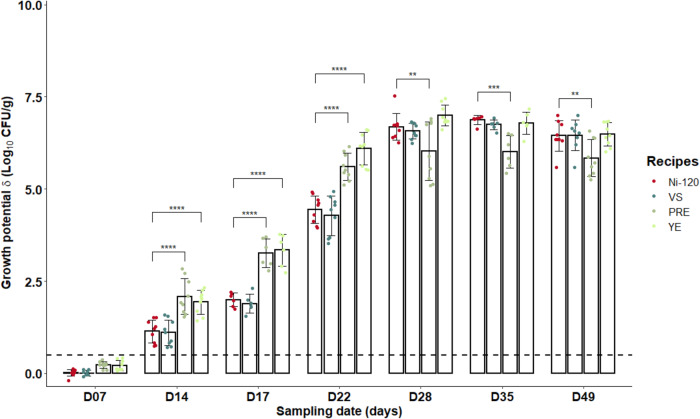
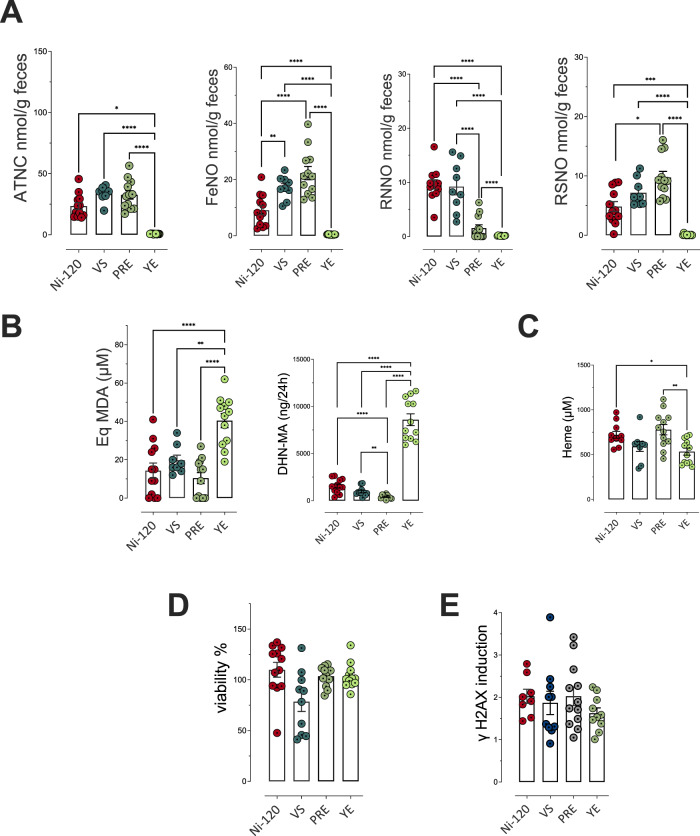
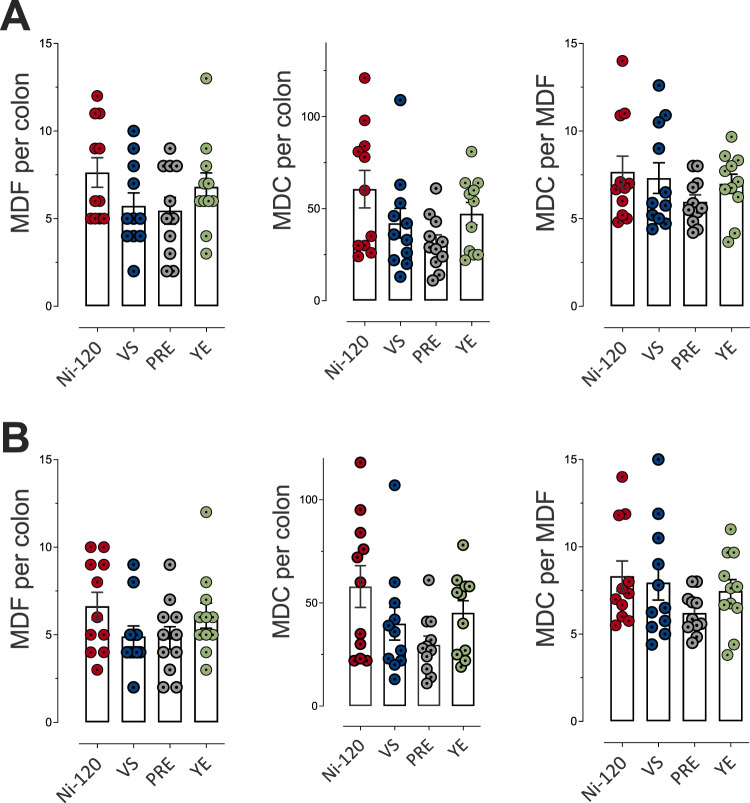
Epidemiological and experimental evidence indicated that processed meat consumption is associated with colorectal cancer risks. Several studies suggest the involvement of nitrite or nitrate additives via N-nitroso-compound formation (NOCs). Compared to the reference level (120 mg/kg of ham), sodium nitrite removal and reduction (90 mg/kg) similarly decreased preneoplastic lesions in F344 rats, but only reduction had an inhibitory effect on Listeria monocytogenes growth comparable to that obtained using the reference nitrite level and an effective lipid peroxidation control. Among the three nitrite salt alternatives tested, none of them led to a significant gain when compared to the reference level: vegetable stock, due to nitrate presence, was very similar to this reference nitrite level, yeast extract induced a strong luminal peroxidation and no decrease in preneoplastic lesions in rats despite the absence of NOCs, and polyphenol rich extract induced the clearest downward trend on preneoplastic lesions in rats but the concomitant presence of nitrosyl iron in feces. Except the vegetable stock, other alternatives were less efficient than sodium nitrite in reducing L. monocytogenes growth.


Conflict of interest statement

A.P., B.F., J.-L.M., S.J. and G.N. declare competing financial interests: they are employed by the French Pork Institute (IFIP). F.P., F.G. and V.S.-L. declare competing financial interests: some research projects from their academic research teams have been co-financed by the processed meat sector. C.B., N.N., E.F., V.B., J.D., P.P., C.H.T., L.T., E.K., N.P., L.A., V.T., M.O., G.C. and T.K. declare no competing financial or non-financial interests.

Figures

Fig. 1
Fig. 1. Growth potentials (δ) of Listeria monocytogenes at several sampling times during shelf-life of the sliced cooked ham model products with different sodium nitrite levels (0 vs 90 or 120 mg/kg).
Data were represented using scatter plots with bar (mean ± SD, n = 3), significance was determined by ANOVA test followed pairwise comparison using the estimated marginal means. **p ≤ 0.01, ****p ≤ 0.0001. The dashed line represents the limit value of 0.5 Log10 CFU/g above which the cooked ham model samples support the growth of L. monocytogenes.
Fig. 2
Fig. 2. Impact of sodium nitrite levels in cooked ham models (0 vs 90 vs 120 mg/kg) on fecal and urinary biomarkers of lipid peroxidation and NOC formation.
A Nitroso-compounds in fecal water measured as apparent total NOCs (ATNC), as nitrosyl iron (FeNO), N-nitroso compounds (RNNO) and S-nitrosothiols (RSNO) (nmol/g of feces). B Lipid peroxidation measured as TBARS (MDA equivalents, µM) in fecal water and DHN-MA in urine of 24 h (ng/vol of 24 h). C Heme in fecal water (µM). D Cytotoxic activity of fecal water as % of cellular viability. E Genotoxic activity of fecal water. Data were represented using scatter plots with bar (mean ± sem, n = 12, except if outliers are removed), significance was determined by ANOVA (Welch’s ANOVA for D) followed by a Dunnett’s mean comparison test, data from panel A and B (DHN-MA) were log transformed before ANOVA. *p ≤ 0.05; **p ≤ 0.01; ***p ≤ 0.001.
Fig. 3
Fig. 3. Impact of sodium nitrite levels in cooked ham models (0 vs 90 vs 120 mg/kg) on fecal microbiota.
A Distribution of bacterial communities at the order level. * Significant impact on Peptococccales and Peptostreptococcales-Tissierellales using differential abundance analysis at the order level (Deseq2, Padj ≤ 0.05): Normalized Log10 abundances were represented using scatter plots with bar (mean ± sem, n = 12). B Alpha diversity: No significant impact seen on richness (Chao-1) or eveness (Shannon). Individual values are represented using box and whiskers ( + mean). C Beta diversity (Unifrac distances, manova p > 0.05). No significant difference between microbiota of rats fed the 3 cooked ham model diets. D Heatmap of clusters agglomerated at the genus level affected by sodium nitrite content in ham-based diets. Padj ≤ 0.05 using differential abundance analysis (Deseq2). E Normalized abundance of the 6 clusters displaying dose effects as a function of dietary sodium nitrite content in (D). Clusters are agglomerated at the genus level and normalized Log10 abundances were represented using scatter plots with bar (mean ± sem, n = 12), significance was determined by a Kruskal-Wallis followed by Dunn’s mean comparison test.**p ≤ 0.05; **p ≤ 0.01.
Fig. 4
Fig. 4. Impact of sodium nitrite levels in cooked ham models (0 vs 90 vs 120 mg/kg) on MDF formation in rat colon.
A Number of MDF per colon, of mucin depleted crypts (MDC) per colon and crypts per focus for MDF with a multiplicity (i.e. the number of crypts forming each focus) higher than 2 crypts/MDF. B Number of MDF per colon, of MDC per colon and crypts per focus for MDF with a multiplicity higher than 4 crypts/MDF. Data were represented using scatter plots with bar (mean ± sem, n = 11), significance was determined by ANOVA followed by a Dunnett’s mean comparison test. *p ≤ 0.05; **p ≤ 0.01.
Fig. 5
Fig. 5. Growth potentials (δ) of Listeria monocytogenes at several sampling times during shelf-life of the sliced cooked ham model products with alternatives to nitrites.
(120 mg/kg of nitrite or Vegetable Stock (VS), Polyphenol-rich Extract (PRE), Lallemand solution (YE)). Data were represented using scatter plots with bar (mean ± SD, n = 3), significance was determined by ANOVA test followed pairwise comparison using the estimated marginal means. **p < 0.01, ***p < 0.001, ****p < 0.0001. The dashed line represents the limit value of 0.5 Log10 CFU/g above which the cooked ham samples support the growth of L. monocytogenes.
Fig. 6
Fig. 6. Impact of nitrite salt alternatives (Vegetable Stock (VS), Polyphenol-rich Extract (PRE), Lallemand solution (YE)) on fecal and urinary biomarkers of NOCs formation and lipid peroxidation.
A Nitroso-compounds in fecal water measured as total NOCs (ATNC), as nitrosyl iron (FeNO), N-nitroso compounds (RNNO) and S-nitrosothiols (RSNO) (nmol/g of feces). B Lipid peroxidation measured as TBARS (MDA equivalents, µM) in fecal water and DHN-MA in urine of 24 h (ng/vol of 24 h). C Heme in fecal water (µM). D Cytotoxic activity of fecal water as % of cellular viability. E Genotoxic activity of fecal water. Data were represented using scatter plots with bar (mean ± sem, n = 12, except if outliers are removed), significance was determined by ANOVA (Welch’s ANOVA for D) followed by Tukey’s mean comparison, data from (A) and (B) (DHN-MA) were log transformed before ANOVA. *p ≤ 0.05; **p ≤ 0.01.
Fig. 7
Fig. 7. Impact of alternatives to sodium nitrites 120 mg/kg (Vegetable Stock (VS), Polyphenol-rich Extract (PRE), Lallemand solution (YE) on fecal microbiota.
A Distribution of bacterial communities at the order level. *Main impact on Bifidobacteriales, Desulfovibrionales, Peptococccales and Peptostreptococcales-Tissierellales using differential abundance analysis at the order level (Deseq2, Padj ≤ 0.05): Normalized Log10 abundances were represented using scatter plots with bar (mean ± sem, n = 12). B Alpha diversity: No significant impact seen on richness (Chao-1) or eveness (Shannon). Individual values are represented using box and whiskers ( + mean). C Beta diversity (Unifrac distances, manova p ≤ 0.001). The rats fed the 4 meat-based diets clustered differentially according to their respective microbiota in terms of qualitative abundance and taxonomy of OTUs. D Heatmap of clusters agglomerated at the genus level affected by the meat-based diets (15 clusters). Padj ≤ 0.05 using differential abundance analysis (Deseq2). E Normalized abundance of the 4 clusters in D displaying specificities associated with the fermented Vegetable Stock diet (VS). Clusters are agglomerated at the genus level and normalized Log10 abundances were represented using scatter plots with bar (mean ± sem, n = 12) F Normalized abundance of the 4 clusters in D displaying specificities associated with the Polyphenol-rich Extract diet (PRE). Clusters are agglomerated at the genus level and normalized Log10 abundances were represented using scatter plots with bar (mean ± sem, n = 12). G Normalized abundance of the 7 clusters in D displaying specificities associated with the Lallemand solution (YE). Clusters are agglomerated at the genus level and normalized Log10 abundances were represented using scatter plots with bar (mean ± sem, n = 12), significance was determined by a Kruskal-Wallis followed by Dunn’s mean comparison test.*p ≤ 0.05; **p ≤ 0.01; ***p ≤ 0.001.
Fig. 8
Fig. 8. Impact of alternatives to sodium nitrite (Vegetable Stock (VS), Polyphenol-rich Extract (PRE), Lallemand solution (YE)) on MDF formation in rat colon.
A Number of MDF per colon, of mucin depleted crypts (MDC) per colon and crypts per focus for MDF with a multiplicity (i.e. the number of crypts forming each focus) higher than 2 crypts/MDF. B Number of MDF per colon, of MDC per colon and crypts per focus for MDF with a multiplicity higher than 4 crypts/MDF. Data were represented using scatter plots with bar (mean ± sem, n = 11).

References

    1. Bouvard V, et al. Carcinogenicity of consumption of red and processed meat. Lancet Oncol. 2015;16:1599–1600. - PubMed
    1. IARC Working Group on the Evaluation of Carcinogenic Risk to Humans. Red Meat and Processed Meat. (International Agency for Research on Cancer, 2018). - PubMed
    1. WCRF/AICR. WCRF. Food, nutrition, physical activity, and the prevention of cancer: a global perspective. (World Cancer Research Fund and American Institute for Cancer Research, 1997).
    1. WCRF/AICR. Continuous Update Project Expert Report 2018. Meat, fish and dairy products and the risk of cancer. (World Cancer Research Fund and American Institute for Cancer Research, 2018).
    1. Pierre FHF, et al. Freeze-dried ham promotes azoxymethane-induced mucin-depleted foci and aberrant crypt foci in rat colon. Nutr. Cancer. 2010;62:567–573. - PMC - PubMed