. 2023 Oct 7;14(1):6269.
doi: 10.1038/s41467-023-41852-z.

URI alleviates tyrosine kinase inhibitors-induced ferroptosis by reprogramming lipid metabolism in p53 wild-type liver cancers

Affiliations

URI alleviates tyrosine kinase inhibitors-induced ferroptosis by reprogramming lipid metabolism in p53 wild-type liver cancers

Zhiwen Ding et al. Nat Commun. .

Abstract

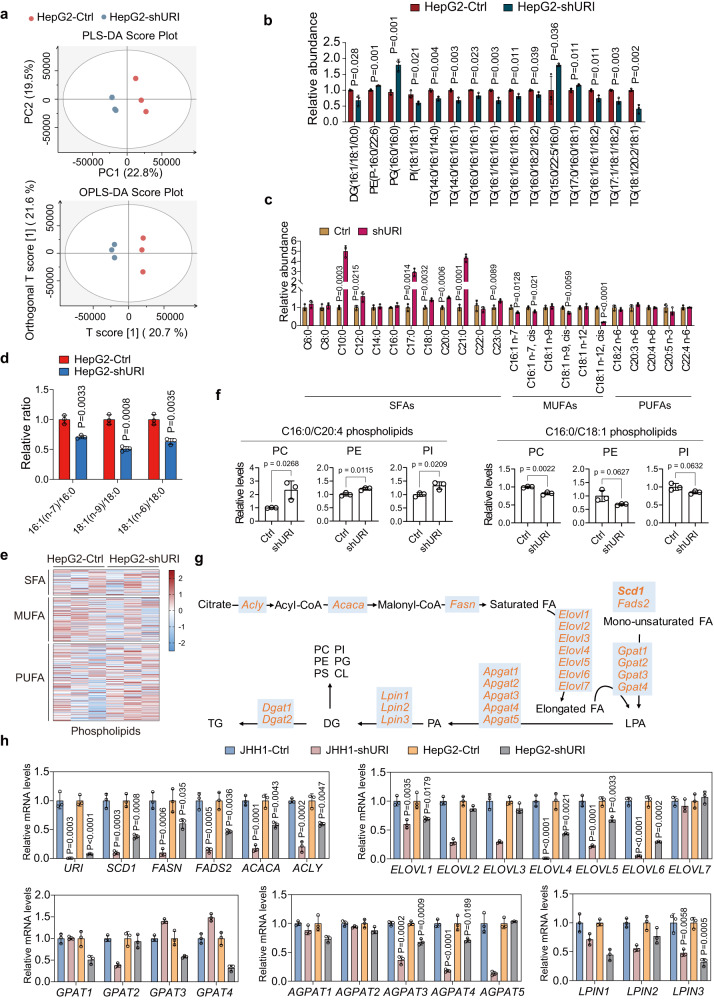
The clinical benefit of tyrosine kinase inhibitors (TKIs)-based systemic therapy for advanced hepatocellular carcinoma (HCC) is limited due to drug resistance. Here, we uncover that lipid metabolism reprogramming mediated by unconventional prefoldin RPB5 interactor (URI) endows HCC with resistance to TKIs-induced ferroptosis. Mechanistically, URI directly interacts with TRIM28 and promotes p53 ubiquitination and degradation in a TRIM28-MDM2 dependent manner. Importantly, p53 binds to the promoter of stearoyl-CoA desaturase 1 (SCD1) and represses its transcription. High expression of URI is correlated with high level of SCD1 and their synergetic expression predicts poor prognosis and TKIs resistance in HCC. The combination of SCD1 inhibitor aramchol and deuterated sorafenib derivative donafenib displays promising anti-tumor effects in p53-wild type HCC patient-derived organoids and xenografted tumors. This combination therapy has potential clinical benefits for the patients with advanced HCC who have wild-type p53 and high levels of URI/SCD1.


Conflict of interest statement

The authors declared no competing interests.

Figures

Fig. 1
Fig. 1. URI depletion promotes TKIs-induced ferroptosis in cancer cells.
a Kyoto Encyclopedia of Genes and Genomes (KEGG) analysis of the differential expressed genes between HepG2-shURI and control cells. The top 24 enriched pathways were listed. The bubble size indicates changed gene numbers and colors represent false discovery rate (P‐value). b Analysis of “WP_Ferroptosis” geneset between HepG2-shURI and control cells by GSEA software (v4.1.0), the NES and FDR P-value were shown. c Relative viability of JHH1 and HepG2 cells treated with different concentrations of sorafenib, lenvatinib, regarofenib, apatinib, erlotinib or donafenib for 48 h and cell viability was assayed by measuring cellular ATP levels (n = 3 biological replicates). d HepG2 cells were treated as indicated for 48 h and cells were then stained with 20 μM C11-BODIPY followed by flow cytometry (n = 3 biological replicates). Sorafenib, (10 μM); lenvatinib, (10 μM); regarofenib (10 μM) for JHH1 cells and (5 μM) for HepG2 cells; apatinib, (20 μM); erlotnib, (20 μM); donafenib, (10 μM). e IC50 values were calculated according to experiments in Supplementary Fig. 2c. f, g, Long-term colony-formation assay of cells treated with or without 2.5 μM sorafenib for 14 days (f), and the quantification of clones were shown in (g) (n = 3 biological replicates). h Cells were treated with or without sorafenib (10 μM) for 24 h and lipid peroxidation was measured (n = 3 biological replicates). i Cells were treated with or without sorafenib (10 μM), antioxidant N-acetylcysteine (NAC, 1000 μM), apoptosis inhibitor Z-VAD-FMK (50 μM), ferroptosis inhibitor ferrostatin-1 (Fer-1, 10 μM), necrosis inhibitor necrostatin-1 (Nec-, 50 μM) or autophagy inhibitor 3-methyladenine (3-MA, 10 μM) as indicated for 48 h, then cell viability was measured (n = 3 biological replicates). Data are means ± SEM. Statistical significance in (ce) and (gi) is determined by two-tailed unpaired t-test. Source data are provided as a Source Data file.
Fig. 2
Fig. 2. URI depletion altered lipid metabolism of cancer cells.
a Lipid profiles of the cells were compared using partial least squares discriminant analysis (PLS-DA) or orthogonal (O)PLS-DA models. b Relative abundance of different diacylglycerol, phospholipids and triacylglycerol that contain C16 and C18 acyl chain are shown on the basis of Supplementary Fig. 3b (n = 3 biological replicates). c Relative abundance of fatty acid species in HepG2-shURI and control cells (n = 3 biological replicates). d The indicated MUFA/SFA ratios in HepG2-shURI and control cells (n = 3 biological replicates). e Heatmap summarized the phospholipids levels between HepG2-shURI and control cells, and the data were shown as z-score. f Relative levels of C16:0/C20:4 phospholipids and C16:0/C18:1 phospholipids in HepG2-shURI and control cells (n = 3 biological replicates). g Schematic of the hepatic de novo lipogenesis pathway, where genes are represented in yellow and metabolites in black. h Relative mRNA expression for genes encoding major enzymes in hepatic lipogenesis in the indicated cells (n = 3 biological replicates). Data are means ± SEM. Statistical significance in (bd), (f) and (h) is determined by two-tailed unpaired t-test. Source data are provided as a Source Data file.
Fig. 3
Fig. 3. URI alleviated TKI-induced ferroptosis in a SCD1-dependent manner.
a Western blotting (WB) of certain lipid metabolism associated enzymes in HepG2 cells infected with lentivirus containing control or two URI-shRNA sequences, respectively. The relative intensities of WB bands were normalized to GAPDH. Three experiments were performed and the representative images from one experiment were shown. b Relative viability of cells treated with 10 μM sorafenib in the presence and absence of A939572 (10μM), MK8245 (10 μM), or Ferrostatin-1 (20 μM) for 48 h (n = 3 biological replicates). c, d Long-term colony-formation assay of cells treated with 2.5 μM sorafenib (Sora) in the presence and absence of A939572 (A, 2.5 μM), MK8245 (M, 2.5 μM), or Ferrostatin-1 (F, 5 μM) for 14 days (c), and the quantification of three independent assays was shown in (d). e Liperfluo assays of JHH1 and HepG2 cells with or without URI knockdown treated with 10 μM sorafenib in the presence and absence of A939572 (10 μM), MK8245 (10 μM), or Ferrostatin-1 (20μM) for 48 h (n = 3 biological replicates). f JHH1-Ctrl, JHH1-shURI, HepG2-Ctrl, and HepG2-shURI cells were transfected with MOCK or Flag-SCD1 plasmids for 48 h and then treated with 10 μM sorafenib, the relative viability of cells was measured (n = 3 biological replicates). g HepG2-Ctrl and HepG2-shURI cells transfected with MOCK or Flag-SCD1 plasmids were treated with 10μM sorafenib in the presence and absence of A939572 (10 μM) or MK8245 (10 μM) for 48 h and the lipid peroxidation was measured (n = 3 biological replicates). Data are means ± SEM. Statistical significance in (b) and (dg) is determined by two-tailed unpaired t-test. Source data are provided as a Source Data file.
Fig. 4
Fig. 4. URI promotes SCD1 transcription by inhibiting p53.
a Representative WB images of cells infected with shURI-lentivirus or transfected with His-URI plasmids. b Luciferase assay of SCD1 transcriptional activity in cells under steady state (n = 3 biological replicates). c Cells were transfected with si-SREBP, si-ChREBP, si-LXRα for 48 h, and the luciferase activity was measured (n = 3 biological replicates). d ChIP-qPCR was performed on HepG2-Ctrl and HepG2-shURI cells using specific primers flanking the SREBP binding sites (SS) (n = 3 biological replicates). e The p53 binding sites at the SCD1 promoter region according to the p53 CUT&Tag data. f GSEA analysis showed that “WP_p53 transcriptional gene network” was enriched in the HepG2-shURI cells, the FDR P-value and NES were calculated by GSEA software (v4.1.0). g Relative mRNA expression of p53 related genes in HepG2-shURI and control cells. h Representative WB of cells treated with 10μM Dox at the indicated time. i Relative SCD1 mRNA expression in JHH1 and HepG2 cells treated with 10 μM Dox for the indicated time (n = 3 biological replicates). j Representative WB of Hep3B cells transfected with wild-type or mutant p53 plasmids. k Schematic diagram presenting potential p53 binding location and sequence on human SCD1 gene. (R, A/G; W, A/T; Y, C/T; nucleotides C and G in red are essential for p53 binding). TSS, transcription start site. l ChIP assay in HepG2 cells and qPCR was performed using specific primers flanking the p53 binding sites (PS1, PS2), the representative images of three independent experiments were shown. m Representative WB of cells with p53 knockdown treated with 10μM Dox at the indicated time. n ChIP-qPCR of the p53 binding sites (PS1, PS2) in HepG2-shURI and control cells (n = 3 biological replicates). o Representative WB of cells transfected with MOCK or si-p53 for 48 h. p Representative WB of cells infected with gradient doses of shURI lentivirus (MOI, 0, 5, 10, 20) for 48 h. The relative intensities of WB bands were normalized to GAPDH in each experiment. WB were performed at least three independently repeated. Data are means ± SEM. P-values are determined using two-tailed unpaired t-test (bd, i, n). All blots were repeated in three independent experiments and the representative images were shown. Source data are provided as a Source Data file.
Fig. 5
Fig. 5. URI promotes p53 ubiquitination and degradation by interacting with TRIM28.
a Representative WB of cells infected with shURI lentivirus or transfected with His-URI plasmid and then treated with 10 μM Dox for 24 h. b Relative mRNA expression of URI and TP53 in JHH1 and HepG2 cells with or without URI knockdown (n = 3 biological replicates). c Representative WB of cells treated with 50 ng/mL CHX at the indicated time. d Representative WB of cells transfected with HA-tagged ubiquitin for 48 h and immunoprecipitation with anti-p53 or IgG antibodies. e HEK293T cells were transfected with His-URI plasmid before anti-His immunoprecipitation and gel cutting. LC-MS/MS was performed to identify URI potential binding proteins (n = 5 biological replicates). f, Representative WB of HEK293T cells transfected with His-URI plasmid and immunoprecipitated with anti-His antibody. g Representative WB of cells transfected with MOCK or different si-TRIM28 oligos for 48 h. h Cells transfected with HA-tagged ubiquitin and with or without siTRIM28 for 48 h and then treated with 10μM MG132 for 6 h, anti-p53 immunoprecipitation were performed and the indicated proteins were measured. i Cell lysates were subjected to anti-MDM2 immunoprecipitation. Immunoblotting was performed with indicated antibodies. j HEK293T cells were co-transfected with the indicated plasmids for 48 h, and cell lysates were subjected to anti-Flag immunoprecipitation. k GST-pull down shows a dose-dependent direct interacting between His-TRIM28 and GST-URI. l Cells were transfected with MOCK or siTRIM28 for 48 h and then treated with 10 μM sorafenib for 24 h, and cell viability was measured (n = 3 biological replicates). m, n Cells were transfected with MOCK or siTRIM28 for 48 h and then treated with 10 μM sorafenib for 24 h, and the lipid peroxidation was measured (n = 3 biological replicates). All blots were repeated in three independent experiments and the representative images were shown. The values under the panels indicate the quantification of the bands normalized to GAPDH. Data are means ± SEM. Statistical significance in (b) and (ln) is determined by two-tailed unpaired t-test. Source data are provided as a Source Data file.
Fig. 6
Fig. 6. SCD1 inhibitor aramchol enhances the efficacy of donafenib in cancer cells and in patient-derived organoids.
a Cells were treated with aramchol at the indicated concentrations for 48 h, and cell viability was measured (n = 3 biological replicates). b, c Effect of aramchol, donafenib or combination therapy in colony-formation assay of JHH1 and HepG2 cells with or without URI depletion (b), and the quantification of three independent assays were shown in (c). d Schematic representation of HCC patient-derived organoids (PDOs) establishment. e, f Representative images of wild-type p53 HCC-187 PDOs (e) and wild-type p53 HCC-188 PDOs (f) with or without URI depletion treated with aramchol (10 μM), donafenib (10 μM) or combination therapy for 5 days. Scale bar: 200 μm. The experiments were performed with three independent replications, five individual different fields of per well were acquired for every experiment and the representative images were shown. g Relative viability of HCC-187 and HCC-188 PDOs with or without URI depletion treated with donafenib in the presence and absence of aramchol for 5 days (n = 3 biological replicates). h Liperfluo assay of HCC-187 and HCC-188 PODs with or without URI depletion treated with donafenib in the presence and absence of aramchol for 5 days (n = 3 biological replicates). Data are means ± SEM. Statistical significance in (a), (c), (g) and (h) is determined by two-tailed unpaired t-test. Source data are provided as a Source Data file.
Fig. 7
Fig. 7. SCD1 inhibitor aramchol enhances the efficacy of donafenib in vivo.
a Schematic representation of the therapy schedule for donafenib or combination therapy. b Representative tumor images of each group of HepG2-Ctrl and HepG2-shURI xenografts at the end of treatment (n = 5 mice per group). c Tumor weight of each group of HepG2-Ctrl and HepG2-shURI xenografts at the end of treatment is plotted, boxplot center line, mean; box limits, upper and lower quartile; whiskers min. to max (n = 5 mice per group). d Growth curves of each group of HepG2-Ctrl and HepG2-shURI xenografts (n = 5 mice per group). e Representative immunostaining images of URI, SCD1, Ki67, and p53 in sections of xenografted tumors (n = 5 mice per group). Scale bar, 100 μm. f Quantification of IHC staining shown in (e) was determined by using H-score (n = 5 mice per group). g Schematic representation of the therapy schedule of donafenib or combination therapy for advanced xenografted tumors. h Tumor weight of each group of HepG2-Ctrl and HepG2-shURI xenografts at the end of treatment in (g) is plotted, boxplot center line, mean; box limits, upper and lower quartile; whiskers min. to max (n = 4 mice per group). i Growth curves of each group of HepG2-Ctrl and HepG2-shURI xenografts in (g) (n = 4 mice per group). j MDA assay of HepG2-Ctrl and HepG2-shURI xenografts at the end of treatment in (g) (n = 4 mice per group). Data are means ± SEM. Two-tailed unpaired t-test is used for the analysis of statistical significance in (c), (f), (h) and (j). Two-way ANOVA with Tukey multiple comparisons test is used for the analysis of statistical significance in (d) and (i). Source data are provided as a Source Data file.
Fig. 8
Fig. 8. URI combination with SCD1 is associated with poor survival and sorafenib-resistance in advanced HCC patients.
a Representative images of mIHC/IF on samples from cohort A with BCLC B/C stage HCC (n = 134 patients). URI, green; SCD1, red. Nuclei, DAPI (blue). Para-tumor, the adjacent normal-like tissue. Scale bar, 200 μm. b Pearson’s correlation between URI and SCD1 expression in HCC tissues in cohort A by two-tailed test (n = 134 patients). c Percentage of samples with high expression of URI and SCD1 in cohort A. T, tumor; P, para-tumor (n = 134 patients). d Survival analysis of four subgroups (URI low/SCD1 low, URI high/SCD1 low, URI low/SCD1 high and URI high/SCD1 high) from cohort A (n = 134 patients). e The transcriptional status of certain genes between URIhigh versus URIlow patients with wild-type p53 from Fudan_HCC_Cohort, the transcriptional levels were showed as log2 values of gene FPKM ratios between tumor (T) and paired non-tumor (NT), and the URIhigh patients had higher URI levels in tumors than their paired non-tumor tissues, while the URIlow patients had lower tumoral URI levels than non-tumor tissues. f Recurrence free survival analysis and overall survival analysis of URIhigh group and URIlow group in Fudan_HCC_Cohort with wild-type p53 (n = 52 patients). g Recurrence free survival analysis and overall survival analysis of SCD1high and SCD1low group in Fudan_HCC_Cohort with wild-type p53 (n = 52 patients), the SCD1high patients had higher SCD1 levels in tumors than their paired non-tumor tissues, while the SCD1low patients had lower tumoral SCD1 levels than non-tumor tissues. h Survival analysis of p53mut and p53wt group in sorafenib-treated cohort C (n = 80 patients). i Representative IHC staining of URI, p53 and SCD1 in patients with p53WT status from cohort C. Scale bar, 200 μm. j Spearman’s correlation between SCD1 H-score and p53 H-score in p53-wild type (p53-WT) tumors from cohort C (determined by two-tailed test) (n = 46 patients). k Spearman’s correlation between SCD1 H-score and URI H-score in p53-WT tumors from cohort C (determined by two-tailed test) (n = 46 patients). l Survival analysis of SCD1high and SCD1low patients in p53-WT tumors from cohort C (n = 46 patients). m, Survival analysis of URIhigh and URIlow patients in p53-WT tumors from cohort C (n = 46 patients). n Survival analysis of p53high and p53low patients in p53-WT tumors from cohort C (n = 46 patients). o Survival analysis of URIhigh/SCD1high and other groups in p53-WT tumors from cohort C (n = 46 patients). Data are means ± SEM. HR: hazard ratio; Two-sided log-rank test (d, fh, lo), or two-tailed Mann–Whitney test (e). Source data are provided as a Source Data file.
Fig. 9
Fig. 9
Model for the URI-p53-SCD1 axis mediating TKIs resistance and administration of aramchol re-sensitizing liver cancer cells to TKIs.

References

    1. Sung H, et al. Global Cancer Statistics 2020: GLOBOCAN Estimates of Incidence and Mortality Worldwide for 36 Cancers in 185 Countries. CA Cancer J. Clin. 2021;71:209–249. doi: 10.3322/caac.21660. - DOI - PubMed
    1. Vogel A, Meyer T, Sapisochin G, Salem R, Saborowski A. Hepatocellular carcinoma. Lancet. 2022;400:1345–1362. - PubMed
    1. Reig M, et al. BCLC strategy for prognosis prediction and treatment recommendation: the 2022 update. J. Hepatol. 2022;76:681–693. - PMC - PubMed
    1. Llovet JM, et al. Sorafenib in advanced hepatocellular carcinoma. N. Engl. J. Med. 2008;359:378–390. - PubMed
    1. Bruix J, et al. Regorafenib for patients with hepatocellular carcinoma who progressed on sorafenib treatment (RESORCE): a randomised, double-blind, placebo-controlled, phase 3 trial. Lancet. 2017;389:56–66. - PubMed

Publication types

MeSH terms

Substances