. 2023 Nov;32(11):e4801.
doi: 10.1002/pro.4801.

Side-chain dynamics of the α1B -adrenergic receptor determined by NMR via methyl relaxation

Affiliations

Side-chain dynamics of the α1B -adrenergic receptor determined by NMR via methyl relaxation

Christian Baumann et al. Protein Sci. 2023 Nov.

Abstract

G protein-coupled receptors (GPCRs) are medically important membrane proteins that sample inactive, intermediate, and active conformational states characterized by relatively slow interconversions (~μs-ms). On a faster timescale (~ps-ns), the conformational landscape of GPCRs is governed by the rapid dynamics of amino acid side chains. Such dynamics are essential for protein functions such as ligand recognition and allostery. Unfortunately, technical challenges have almost entirely precluded the study of side-chain dynamics for GPCRs. Here, we investigate the rapid side-chain dynamics of a thermostabilized α1B -adrenergic receptor (α1B -AR) as probed by methyl relaxation. We determined order parameters for Ile, Leu, and Val methyl groups in the presence of inverse agonists that bind orthosterically (prazosin, tamsulosin) or allosterically (conopeptide ρ-TIA). Despite the differences in the ligands, the receptor's overall side-chain dynamics are very similar, including those of the apo form. However, ρ-TIA increases the flexibility of Ile1764×56 and possibly of Ile2145×49 , adjacent to Pro2155×50 of the highly conserved P5×50 I3×40 F6×44 motif crucial for receptor activation, suggesting differences in the mechanisms for orthosteric and allosteric receptor inactivation. Overall, increased Ile side-chain rigidity was found for residues closer to the center of the membrane bilayer, correlating with denser packing and lower protein surface exposure. In contrast to two microbial membrane proteins, in α1B -AR Leu exhibited higher flexibility than Ile side chains on average, correlating with the presence of Leu in less densely packed areas and with higher protein-surface exposure than Ile. Our findings demonstrate the feasibility of studying receptor-wide side-chain dynamics in GPCRs to gain functional insights.

Keywords: GPCR; allosteric ligand; inverse agonist; membrane protein; order parameter.


Conflict of interest statement

The authors declare no conflicts of interest.

Figures

FIGURE 1
FIGURE 1
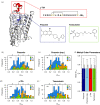
Structural model and [13C,1H]‐HSQC spectrum of the thermostabilized α1B‐AR denoted α1B‐AR‐B1D1 bound to prazosin. The receptor was expressed in E. coli, enabling 13C and 1H labeling of δ‐methyl groups in Ile (green) and Leu residues (blue), and γ‐methyl groups in Val residues (orange). These methyl groups are depicted as spheres on a homology model of α1B‐AR‐B1D1 and on the side chains within the spectrum. The receptor is probed globally using these three amino acids, constituting roughly a third of the entire amino acid content (24 Ile, 47 Leu, and 28 Val in 303 residues).
FIGURE 2
FIGURE 2
Structural model of α1B‐AR‐B1D1 depicting the binding sites of the three investigated inverse agonists and the obtained side‐chain dynamics. (a) Prazosin and tamsulosin are small‐molecule inverse agonists that bind within the transmembrane helical bundle and fill the orthosteric binding pocket, while ρ‐TIA is a conopeptide that binds allosterically at the extracellular receptor surface. The binding of ρ‐TIA to the structural model of α1B‐AR‐B1D1 was based on Ragnarsson et al. (2013)) (b–e) Histograms of the methyl order parameters determined for α1B‐AR‐B1D1 bound to the different inverse agonists. Bars are colored according to the amino acid: Ile in green, Leu in blue, and Val in orange. Dashed lines at S2 axis of 0.32, 0.53, and 0.74 depict borders between motional classes (J', J, α, and ω) as determined using k‐means clustering on all data sets combined. The values for α1B‐AR‐B1D1 bound to prazosin are shown for two independently recorded NMR experiments using the same sample in (b,c). The total number of obtained methyl order parameters from each experiment is indicated in the top left corner. A more detailed analysis comparing populations within the motional classes did not reveal significant differences (Section S4.2). (f) Average methyl order parameter in the presence of the indicated ligand. Error bars represent standard deviations.
FIGURE 3
FIGURE 3
δ‐methyl order parameters of assigned Ile residues. (a) Bar plots of Ile δ‐methyl order parameters as measured with each indicated ligand. Arrows highlight I1764×56 and I2145×49 S2 axis values, which changed notably with ρ‐TIA compared with prazosin and tamsulosin. Error bars indicate the S2 axis standard errors from the fit (for 95% CI and significances see Figures S4.4.1 and S4.4.2). Residues that lead to multiple signals in [13C,1H]‐HSQC spectra for more than one ligand are plotted separately and labeled alphabetically (Figure S2.4). Tamsulosin led to multiple signals for several residues, whose S2 axis values are shown next to one another in the bar plot (I601×47, I219B5×54, I3467×51). Missing bars indicate that no reliable values could be obtained. (b) Crystal structure of inverse agonist‐bound α1B‐AR (PDB entry 7B6W; Deluigi et al., 2022) with Ile δ‐methyl groups shown as spheres. Methyl groups are colored according to the motional class of the mean S2 axis across all ligand‐bound samples. The locations of the two most flexible (I421×29 and I1784×58), the two most rigid Ile side chains (I561×43 and I601×47) as well as the two residues with the most notable ligand‐induced changes in dynamics (I1764×56 and I2145×49) are indicated on the structure. The side chains of both I1764×56 and I2145×49 show enhanced motions in the presence of ρ‐TIA compared with prazosin and tamsulosin. (c) [13C,1H]‐HSQC peaks assigned to the δ‐methyl group I1784×58 in the prazosin‐ and tamsulosin‐bound receptor.
FIGURE 4
FIGURE 4
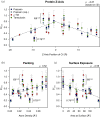
Correlation of Ile δ‐methyl order parameters with structural properties of α1B‐AR. Ile δ‐methyl S2 axis values were correlated to three structural properties of the Ile δ‐methyl groups according to the crystal structure of inverse agonist‐bound α1B‐AR (PDB entry 7B6W; Deluigi et al., 2022). (a) Correlation between Ile S2 axis and the position of δ‐methyl groups along the receptor z‐axis, as determined by the Cδ position. The receptor center was defined as the average z‐coordinate within the α1B‐AR PDB file. Negative and positive z‐coordinates indicate the extracellular and intracellular receptor halves, respectively. (b) Correlation between Ile S2 axis and side‐chain packing. (c) Correlation between Ile S2 axis and surface exposed area of the side chain, as quantified using GETAREA (Fraczkiewicz & Braun, 1998). Spearman's rank correlation coefficient (ρ) is given in the upper right corner of each plot. The two residues that deviate the strongest from the general trends (I561×43 and I1784×58) are labeled in all plots. Error bars indicate the S2 axis standard errors. Dashed trendlines are based on linear regression. Correlations for each individual order parameter data set were significant (p‐value < 0.05) with the exceptions of S2 axis to side‐chain packing and surface exposure in the ρ‐TIA‐bound α1B‐AR‐B1D1 (Figure S4.5.2).
FIGURE 5
FIGURE 5
Distribution of methyl order parameters in α1B‐AR‐B1D1 by amino acid type and comparison of dynamics and structural characteristics between α1B‐AR, bR, and pSRII. (a–c) Histograms of all obtained S2 axis values for α1B‐AR‐B1D1. The total number of S2 axis values per amino acid is shown in the top left corner. (d) Average Ile, Leu, and Val methyl order parameters including the 95% confidence interval for the mean. Data for α1B‐AR‐B1D1 bound to the indicated ligands and for the published S2 axis values of bR (Kooijman, Schuster, et al., 2020) and pSRII (O'Brien et al., 2020) are included. Significances between order parameters were assessed using the Wilcoxon rank‐sum test. Significances are indicated by one (p‐value ≤ 0.05), two (p‐value ≤ 0.01), and three (p‐value ≤ 0.001) stars. The values for bR order parameters were scaled by a factor of 1.17 compared with the published values due to a correction of the rotational correlation time (manuscript in preparation). The numbers indicate the number of order parameters for each amino acid type. (e) Side‐chain packing based on the structures of α1B‐AR (PDB entry 7B6W), bR (PDB entry 5ZIM), and pSRII (PDB entry 1H68). Numbers indicate the number of methyl groups for each amino acid type (considering only the δ‐group for Ile). (f) Protein surface exposure of the side chains relative to the surface of the side chain of the free amino acid. Numbers indicate the number of side chains per amino acid type and protein.
FIGURE 6
FIGURE 6
Comparison of spectra of prazosin‐bound α1B‐AR‐B1D1 (left) and bR (right). Spectra were recorded at 700 MHz and 320 K. Insets highlight peaks at similar shifts or with similar characteristics between the two proteins. [13C,1H]‐HSQCs of ILV‐labeled α1B‐AR‐B1D1 (a) and bR (b) indicate that methyl groups are generally better resolved in bR. Note that there are fewer ILV residues in bR (Ile: 15, Leu: 38, Val: 21) than in α1B‐AR‐B1D1 (Ile: 24, Leu: 47, Val: 28). 15N‐TROSYs of uniformly 15N‐labeled α1B‐AR‐B1D1 (c) and bR (d) indicate exchange processes in both proteins. Note that signals from the TM portions are largely absent in the spectra of α1B‐AR‐B1D1 due to the missing exchange of deuterons to protons for water‐inaccessible amides (Schuster et al., 2020). The overrepresentation of loop amides might make α1B‐AR‐B1D1 appear more dynamic. Rotational correlation times of both proteins are similar (37.07 ns for α1B‐AR‐B1D1 in micelles (138.1 kDa; Schuster et al., 2020) and 42.58 ns for bR in nanodiscs (127 kDa; Kooijman et al., 2020a).
FIGURE 7
FIGURE 7
Localized and overall changes in side‐chain dynamics in the presence of ρ‐TIA. (a) α1B‐AR bound to (+)‐cyclazosin (PDB entry 7B6W) viewed from the extracellular side. The extracellular region of the receptor has been omitted for clarity. Ile side chains with increased flexibility in the ρ‐TIA‐bound α1B‐AR‐B1D1 (I1764×56 and I2145×49) are highlighted in red, while residues of the PIF motif (P2155×50, I1333×40, F3036×44) are highlighted in blue. (b) Difference in experimental and predicted S2 axis of I1764×56 and I2145×49 in ρ‐TIA‐bound α1B‐AR‐B1D1. The predicted values were calculated based on the correlation with packing density in the structure of α1B‐AR bound to (+)‐cyclazosin (PDB entry 7B6W) using a linear model. Negative values indicate a higher flexibility than expected. Error bars indicate the 95% confidence intervals. (c) Correlation between side‐chain packing and Ile S2 axis of prazosin‐ and tamsulosin‐bound α1B‐AR‐B1D1. (d) Correlation between side‐chain packing and Ile S2 axis of ρ‐TIA‐bound α1B‐AR‐B1D1. Error bars indicate the 95% confidence intervals. (e) Spearman's rank correlation coefficients (ρ) between side‐chain packing and individual S2 axis datasets. Individual correlations for side‐chain packing, surface exposure, and protein z‐axis are shown in Figure S4.5.1.

References

    1. Baumann C, Zerbe O. The role of leucine and isoleucine in tuning the hydropathy of class A GPCRs. Proteins. 2023. - PubMed
    1. Berg KA, Clarke WP. Making sense of pharmacology: inverse agonism and functional selectivity. Int J Neuropsychopharmacol. 2018;21(10):962–977. - PMC - PubMed
    1. Best RB, Clarke J, Karplus M. The origin of protein sidechain order parameter distributions. J Am Chem Soc. 2004;126(25):7734–7735. - PubMed
    1. Chen X, Xu Y, Qu L, Wu L, Han G, Guo Y, et al. Molecular mechanism for ligand recognition and subtype selectivity of α2C adrenergic receptor. Cell Rep. 2019;29(10):2936–2943.e2934. - PubMed
    1. Chen Z, Rogge G, Hague C, Alewood D, Colless B, Lewis RJ, et al. Subtype‐selective noncompetitive or competitive inhibition of human α1‐adrenergic receptors by ρ‐TIA. J Biol Chem. 2004;279(34):35326–35333. - PubMed

Publication types

MeSH terms