

Comparison of computational fluid dynamics with transcranial Doppler ultrasound in response to physiological stimuli
- PMID: 37805938
- PMCID: PMC10902019
- DOI: 10.1007/s10237-023-01772-9
Comparison of computational fluid dynamics with transcranial Doppler ultrasound in response to physiological stimuli
Abstract
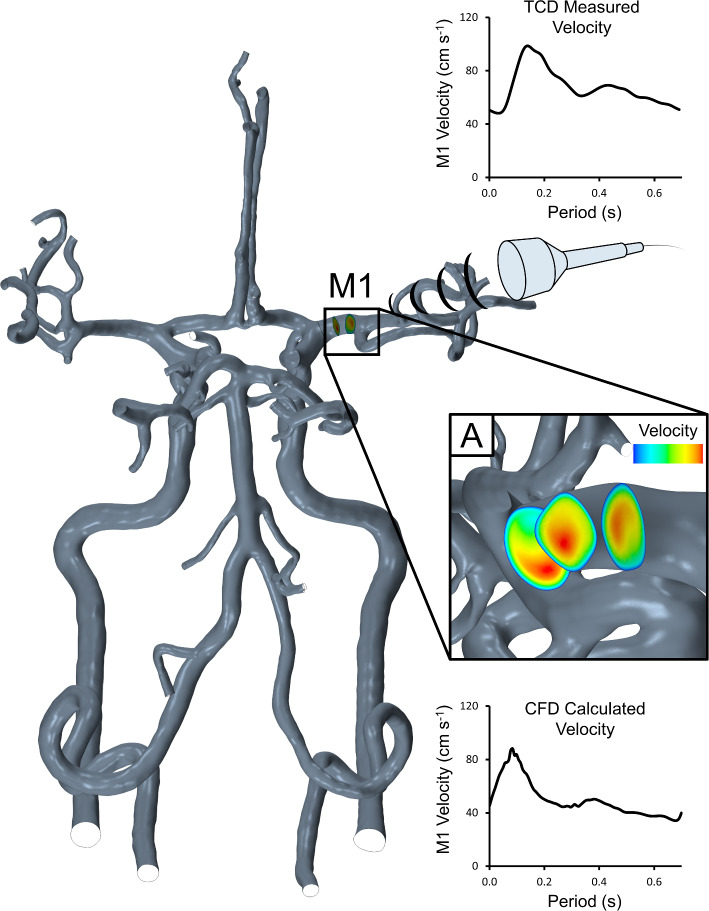
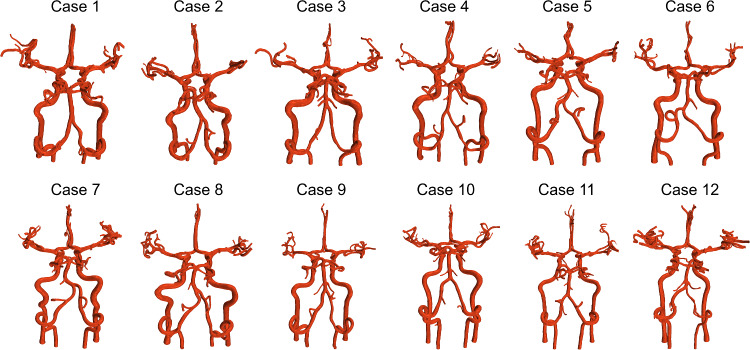
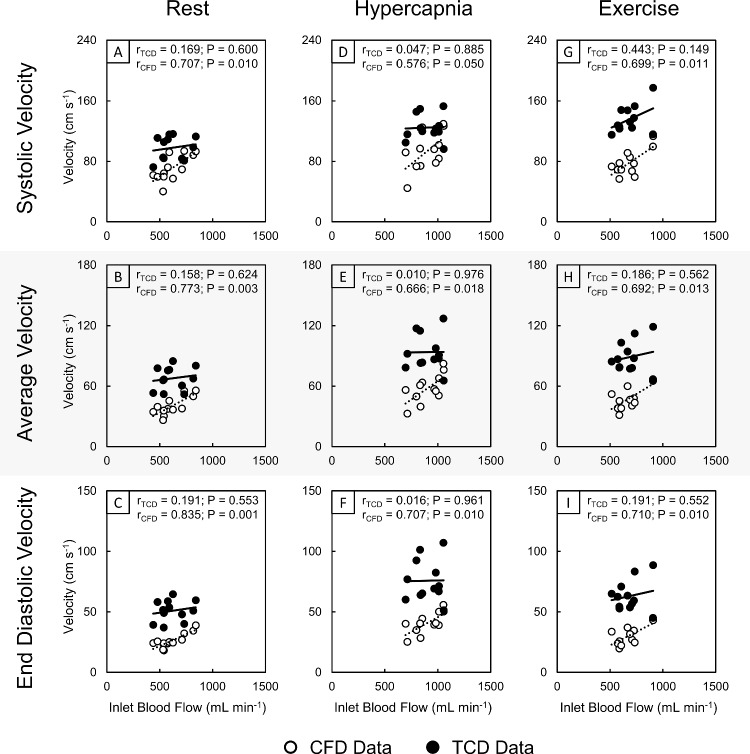
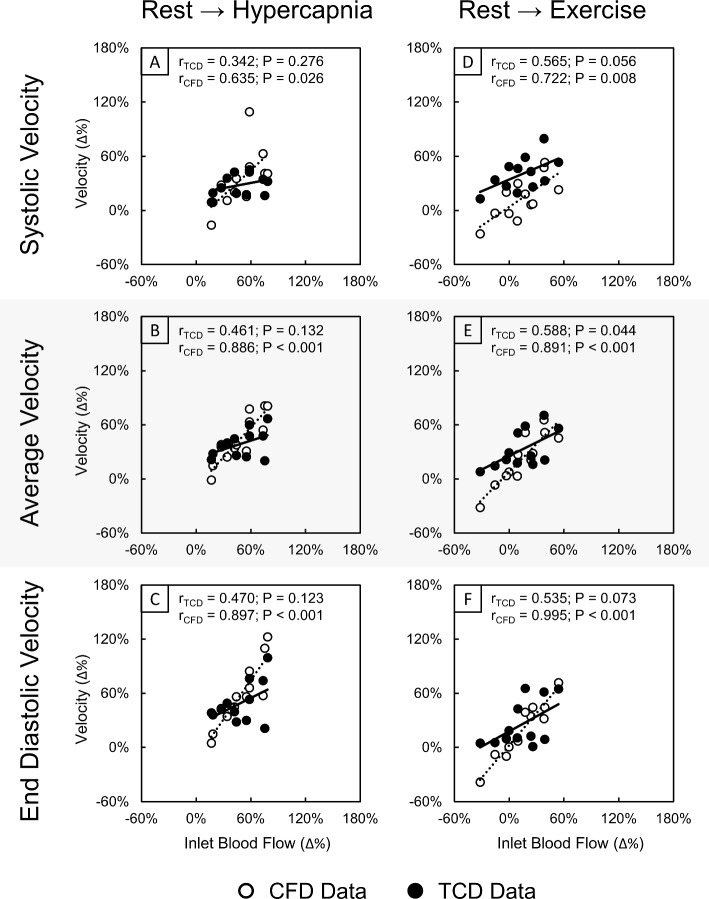
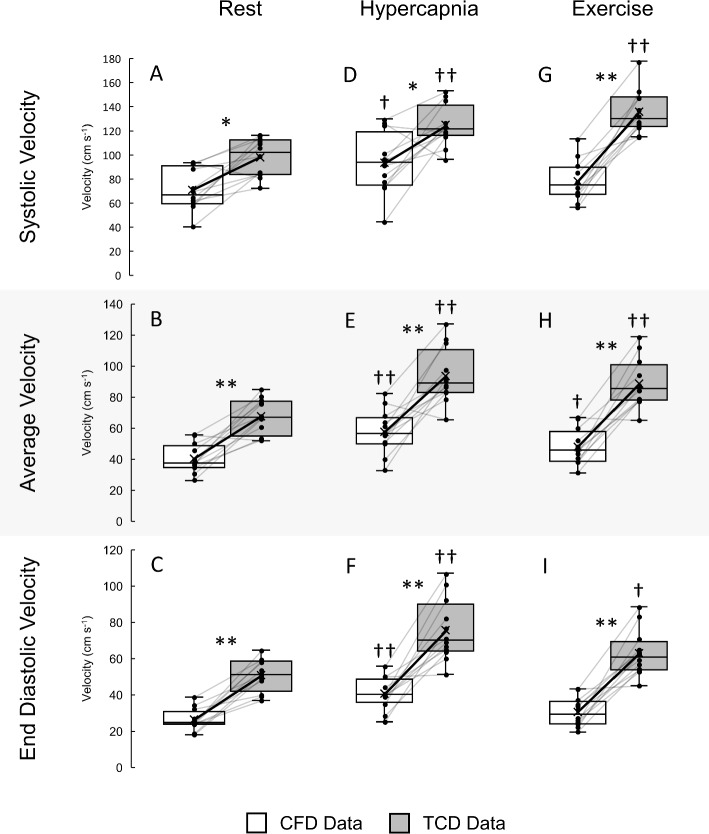
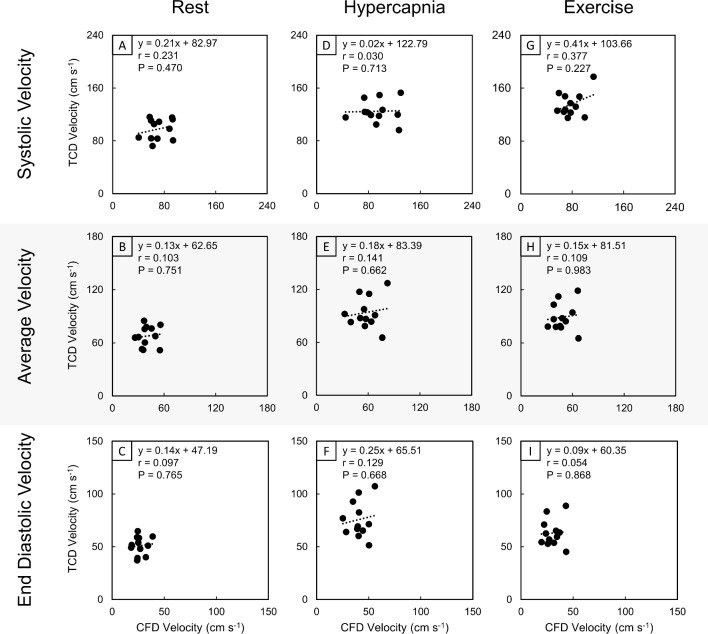
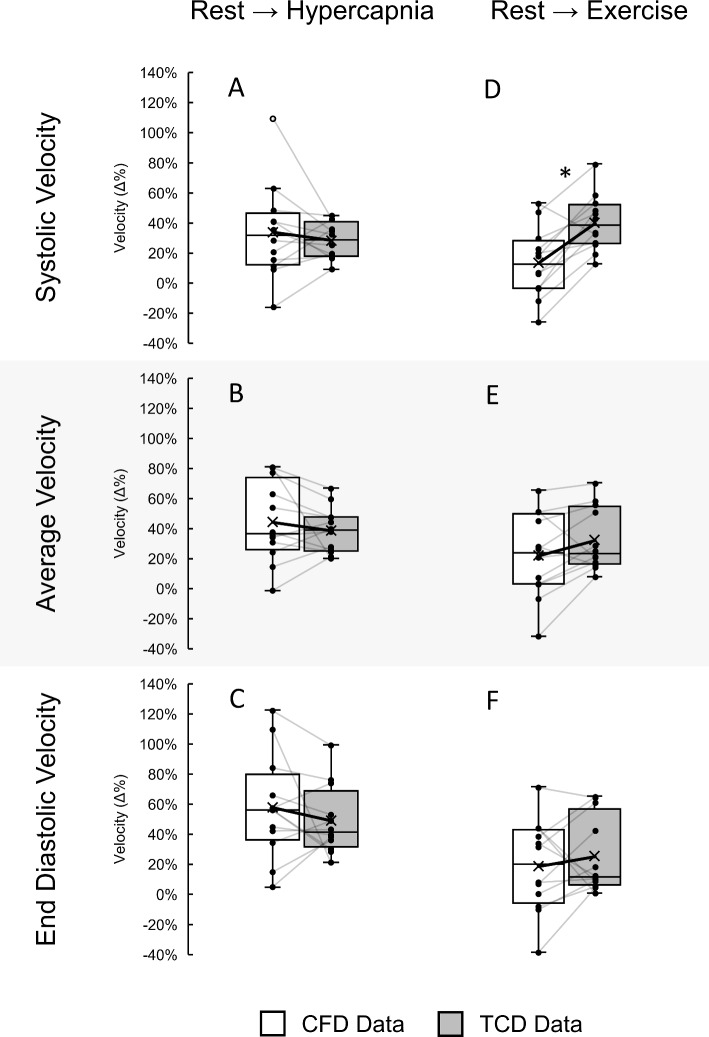
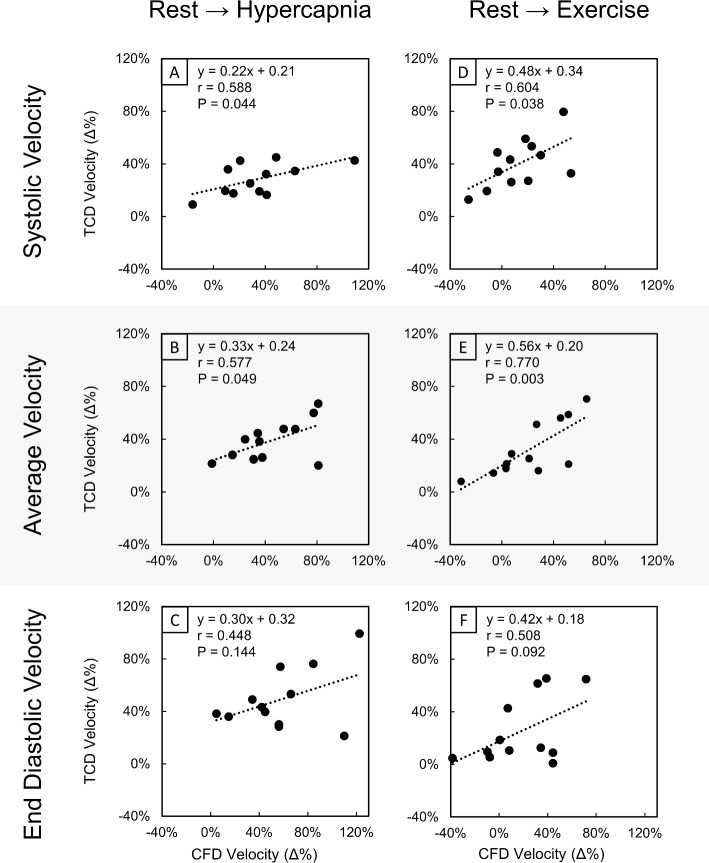
Cerebrovascular haemodynamics are sensitive to multiple physiological stimuli that require synergistic response to maintain adequate perfusion. Understanding haemodynamic changes within cerebral arteries is important to inform how the brain regulates perfusion; however, methods for direct measurement of cerebral haemodynamics in these environments are challenging. The aim of this study was to assess velocity waveform metrics obtained using transcranial Doppler (TCD) with flow-conserving subject-specific three-dimensional (3D) simulations using computational fluid dynamics (CFD). Twelve healthy participants underwent head and neck imaging with 3 T magnetic resonance angiography. Velocity waveforms in the middle cerebral artery were measured with TCD ultrasound, while diameter and velocity were measured using duplex ultrasound in the internal carotid and vertebral arteries to calculate incoming cerebral flow at rest, during hypercapnia and exercise. CFD simulations were developed for each condition, with velocity waveform metrics extracted in the same insonation region as TCD. Exposure to stimuli induced significant changes in cardiorespiratory measures across all participants. Measured absolute TCD velocities were significantly higher than those calculated from CFD (P range < 0.001-0.004), and these data were not correlated across conditions (r range 0.030-0.377, P range 0.227-0.925). However, relative changes in systolic and time-averaged velocity from resting levels exhibited significant positive correlations when the distinct techniques were compared (r range 0.577-0.770, P range 0.003-0.049). Our data indicate that while absolute measures of cerebral velocity differ between TCD and 3D CFD simulation, physiological changes from resting levels in systolic and time-averaged velocity are significantly correlated between techniques.
Keywords: Cerebral vasculature; Computational fluid dynamics; Stimuli; Transcranial Doppler ultrasound.
© 2023. The Author(s).
Conflict of interest statement
There are no competing interests.
Figures
Similar articles
-
Assessment of intracranial blood flow velocities using a computer controlled vasoactive stimulus: a comparison between phase contrast magnetic resonance angiography and transcranial Doppler ultrasonography.J Magn Reson Imaging. 2013 Sep;38(3):733-8. doi: 10.1002/jmri.23911. Epub 2012 Nov 12. J Magn Reson Imaging. 2013. PMID: 23148038
-
Takayasu arteritis: ultrasonographic evaluation of the cervico-cerebral arteries.Int J Cardiol. 1998 Oct 1;66 Suppl 1:S163-73. doi: 10.1016/s0167-5273(98)00164-8. Int J Cardiol. 1998. PMID: 9951816
-
Transcranial Doppler ultrasound in the evaluation of collateral blood flow in patients with internal carotid artery occlusion: correlation with cerebral angiography.AJNR Am J Neuroradiol. 1995 Jan;16(1):195-202. AJNR Am J Neuroradiol. 1995. PMID: 7900593 Free PMC article.
-
Utility of transcranial Doppler ultrasound for the integrative assessment of cerebrovascular function.J Neurosci Methods. 2011 Mar 30;196(2):221-37. doi: 10.1016/j.jneumeth.2011.01.011. Epub 2011 Jan 27. J Neurosci Methods. 2011. PMID: 21276818 Review.
-
Transcranial Doppler ultrasonography in neurological surgery and neurocritical care.Neurosurg Focus. 2019 Dec 1;47(6):E2. doi: 10.3171/2019.9.FOCUS19611. Neurosurg Focus. 2019. PMID: 31786564 Review.
Cited by
-
Retinal and cerebral hemodynamics redistribute to favor thermoregulation in response to passive environmental heating and heated exercise in humans.Temperature (Austin). 2024 Oct 16;12(1):55-70. doi: 10.1080/23328940.2024.2411771. eCollection 2025. Temperature (Austin). 2024. PMID: 40041160 Free PMC article.
-
Changes in preoperative and postoperative blood flow parameters are closely associated with in-stent stenosis after flow diverter treatment in unruptured intracranial aneurysms: a retrospective cohort study.Neurosurg Rev. 2025 Jun 2;48(1):473. doi: 10.1007/s10143-025-03569-z. Neurosurg Rev. 2025. PMID: 40455289
References
MeSH terms
Grants and funding
LinkOut - more resources
Full Text Sources
Miscellaneous
