. 2023 Oct 8;85(11):111.
doi: 10.1007/s11538-023-01214-8.

Free and Interfacial Boundaries in Individual-Based Models of Multicellular Biological systems

Affiliations

Free and Interfacial Boundaries in Individual-Based Models of Multicellular Biological systems

Domenic P J Germano et al. Bull Math Biol. .

Abstract

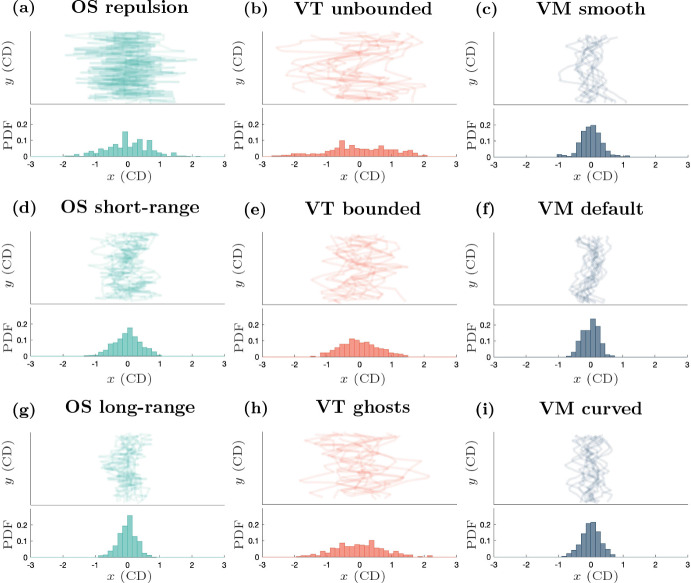
Coordination of cell behaviour is key to a myriad of biological processes including tissue morphogenesis, wound healing, and tumour growth. As such, individual-based computational models, which explicitly describe inter-cellular interactions, are commonly used to model collective cell dynamics. However, when using individual-based models, it is unclear how descriptions of cell boundaries affect overall population dynamics. In order to investigate this we define three cell boundary descriptions of varying complexities for each of three widely used off-lattice individual-based models: overlapping spheres, Voronoi tessellation, and vertex models. We apply our models to multiple biological scenarios to investigate how cell boundary description can influence tissue-scale behaviour. We find that the Voronoi tessellation model is most sensitive to changes in the cell boundary description with basic models being inappropriate in many cases. The timescale of tissue evolution when using an overlapping spheres model is coupled to the boundary description. The vertex model is demonstrated to be the most stable to changes in boundary description, though still exhibits timescale sensitivity. When using individual-based computational models one should carefully consider how cell boundaries are defined. To inform future work, we provide an exploration of common individual-based models and cell boundary descriptions in frequently studied biological scenarios and discuss their benefits and disadvantages.

Keywords: Cell boundaries; Individual-based models; Tissue growth; Wound healing.


Figures

Fig. 1
Fig. 1
Timeline of individual-based tissue models (Drasdo et al. ; Palsson and Othmer ; Meineke et al. ; Nagai and Honda ; Drasdo and Höhme , ; Galle et al. ; Schaller and Meyer-Hermann ; Nagai and Honda ; Sun et al. ; Van Leeuwen et al. ; Nagai and Honda ; Bock et al. ; Vitorino et al. ; Smith et al. ; Drasdo and Hoehme ; Salm and Pismen ; Rey and Garcia-Aznar ; Fletcher et al. ; Ishimoto and Morishita ; Kachalo et al. ; Barton et al. ; González-Valverde and García-Aznar ; Lin et al. ; Ghaffarizadeh et al. ; Mosaffa et al. ; Staddon et al. ; Tetley et al. ; Mosaffa et al. ; Bonilla et al. 2020). Author names are in bold text, with a description of the boundary type used in plain text. The centre of the shape corresponds to the year of publication along the horizontal axis. Circles represent overlapping spheres models, rectangles with a diagonal line represent Voronoi tessellation models and hexagons represent vertex models. Rectangles with a triangle on top represent models that are hybrid models (using forces on both cell centres and polygonal vertices). Red coloured shapes have void closure applications with little or no cell proliferation, yellow shapes have tumour growth applications and blue shapes represent colliding tissue front applications. Shapes that have multiple colours are papers with multiple applications. White coloured shapes have other applications, but are significant for their contributions on the discussions of cell boundaries. The height of the grey bars in the background represent the natural logarithm of the cumulative number of papers up to and including the corresponding year that can be found using the search terms ‘off-lattice individual-cell model’ using Google Scholar. Note that this terminology first appears in the literature in 2003, therefore the bars corresponding to the years from 1997 to 2004 show the natural logarithm of the cumulative number of citations of early publications of each model type: OS (Drasdo et al. 1995), VT (Meineke et al. 2001) and VM (Nagai and Honda 2001) (Color figure online)
Fig. 2
Fig. 2
(color figure online) Model schematics for void closure, tissue growth and tissue collisions. In vitro snapshots of a wound closure b tumour growth, and c colliding tissues. Left panels of in vitro figures are early time, right panels are later times. Model schematics of d void closure, e a growing tissue and f tissue collision. Images are adapted from (Vedula et al. 2015), (Murphy et al. 2022) and (Heinrich et al. 2022)
Fig. 3
Fig. 3
Cell boundary description schematics. OS models are pictured in (a), (d) and (g) (left column); VT models are shown in (b), (e) and (h) (middle column); and VMs are shown in (c), (f) and (i) (right column). The most computationally efficient boundaries are shown in (a)–(c) (top row). The most commonly used boundaries are displayed in (d)-(f) (middle row). The most computationally complex boundaries are shown in (g)–(i) (bottom row) (Color figure online)
Fig. 4
Fig. 4
Void outlines over time. Initial cell positions and configuration in blue, and void boundary traces for each model setup at later times. Orange outlines correspond to void boundary traces at later times, if the void has not closed. Void outlines are plotted every 0.04 h until the void has zero area or 20 outlines have been plotted, whichever occurs first. The small ‘dots’ seen in (a), the OS repulsion case, are small tears that occur in the tissue at various times due to how the boundaries are defined, see Appendix C. Videos of all simulations are provided in the Supplementary Video 1 (Color figure online)
Fig. 5
Fig. 5
(color figure online) Void area over time curves for each model. The curve corresponding to the simplest cell boundary description for each model is plotted using a solid line and the curves corresponding to the most computationally complex cell boundaries are plotted with a dotted line. The dashed curves correspond to the most common cell boundary descriptions. Note the log scale for the time axis. A consequence of the scaling is that the void area at t=0 is not shown, but can be inferred from Fig. 4
Fig. 6
Fig. 6
Example growing tissue outlines over time. Initial outline plotted in blue, later times plotted in orange. Outlines plotted every 2.5 h. Videos are provided in Supplementary Video 2 (Color figure online)
Fig. 7
Fig. 7
(color figure online) Cell numbers, tissue circularity and cell quiescence over time. ac Number of cells within the tissue over time. df Tissue circularity over time. gi Proportion of quiescent cells within the tissue over time. Darker lines show averages, shaded regions show 95% confidence intervals for ten simulations. All results are smoothed using a moving average with a sample width of ten data (time) points
Fig. 8
Fig. 8
Cell outlines for example tissue collision simulations. Initial conditions are shown in black, final frames (at t=40 h) are shown by a green population on the left (cell label B) and purple population on the right (cell label A). Cells at the interface of the two populations are indicated via darker outlines. For clarity, the cells in the OS model have been plotted with a size of 0.95 CD. Videos of each simulation are provided in Supplementary Video 3 (Color figure online)
Fig. 9
Fig. 9
(color figure online) Tissue collision interface structure. Top panels: interface plots (x-y axes) for the 12 individual simulations of each model at t=40 h, after the two populations have collided. Bottom panels: histograms showing the probability distributions of the pooled x-positions of the interface between the two populations for the 12 simulations
Fig. 10
Fig. 10
(Color figure online) How to allocate extra nodes in the bounded VT simulations
Fig. 11
Fig. 11
Resolution of boundary node-boundary node collision with a neighbouring node in common. The neighbouring node in common is shared by elements 1 and 2, with the nodes are colliding
Fig. 12
Fig. 12
Resolution of boundary node-boundary edge collision. Here, the node that is too close to the edge is added to the element belonging to the edge, joining the two elements together
Fig. 13
Fig. 13
Resolution of boundary node-boundary edge collision. Here, the node that is too close to the edge is added to the element belonging to the edge, joining the two elements together
Fig. 14
Fig. 14
Resolution of void consisting of boundary nodes. When the void is sufficiently small, we remove the void by merging the 3 boundary nodes at their centre of mass. The merged node is now an internal node
Fig. 15
Fig. 15
A depiction of the void area calculation for overlapping spheres. The solid black dot represents the cell’s centre, the solid black circle the cell’s boundary and the dashed grey circle the cell-pixel interaction radius, rcell-pixel. The red squares are the discrete pixels contributing to the void area (Color figure online)
Fig. 16
Fig. 16
A depiction of the boundary calculation for overlapping spheres and Voronoi tessellation. The solid black dot represents the cell’s centre, the solid black circle/lines the cell’s boundary, the dashed grey circle the cell-pixel interaction radius, rcell-pixel, and the dashed blue circle the extended cell-pixel interaction radius, rcell-pixelE. The red squares are the discrete pixel mesh (Color figure online)

References

    1. Ajeti V, Tabatabai AP, Fleszar AJ, Staddon MF, Seara DS, Suarez C, Yousafzai MS, Bi D, Kovar DR, Banerjee S. Wound healing coordinates actin architectures to regulate mechanical work. Nat Phys. 2019;15(7):696–705. - PMC - PubMed
    1. Barton DL, Henkes S, Weijer CJ, Sknepnek R. Active vertex model for cell-resolution description of epithelial tissue mechanics. PLoS Comput Biol. 2017;13(6):1005569. - PMC - PubMed
    1. Becker JC, Stang A, DeCaprio JA, Cerroni L, Lebbé C, Veness M, Nghiem P. Merkel cell carcinoma. Nat Rev Dis Primers. 2017;3(1):1–17. - PMC - PubMed
    1. Bock M, Tyagi AK, Kreft J-U, Alt W. Generalized voronoi tessellation as a model of two-dimensional cell tissue dynamics. Bull Math Biol. 2010;72(7):1696–1731. - PubMed
    1. Bonilla LL, Carpio A, Trenado C. Tracking collective cell motion by topological data analysis. PLoS Comput Biol. 2020;16(12):1008407. - PMC - PubMed

Publication types