

Circular-SWAT for deep learning based diagnostic classification of Alzheimer's disease: application to metabolome data
- PMID: 37806288
- PMCID: PMC10579282
- DOI: 10.1016/j.ebiom.2023.104820
Circular-SWAT for deep learning based diagnostic classification of Alzheimer's disease: application to metabolome data
Abstract
Background: Deep learning has shown potential in various scientific domains but faces challenges when applied to complex, high-dimensional multi-omics data. Alzheimer's Disease (AD) is a neurodegenerative disorder that lacks targeted therapeutic options. This study introduces the Circular-Sliding Window Association Test (c-SWAT) to improve the classification accuracy in predicting AD using serum-based metabolomics data, specifically lipidomics.
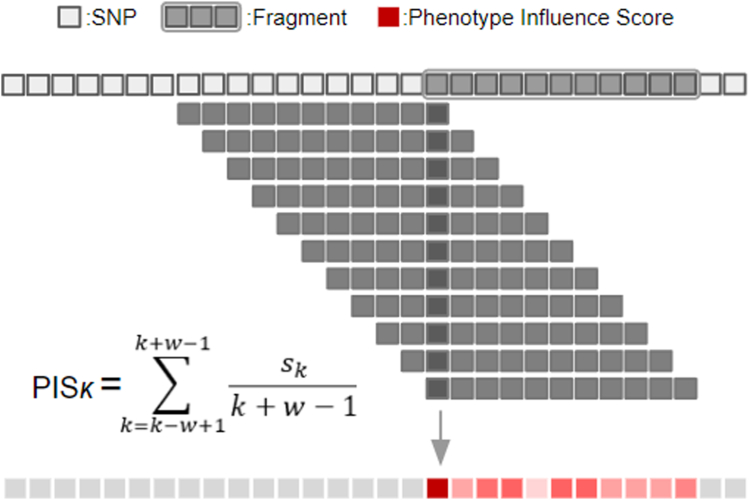
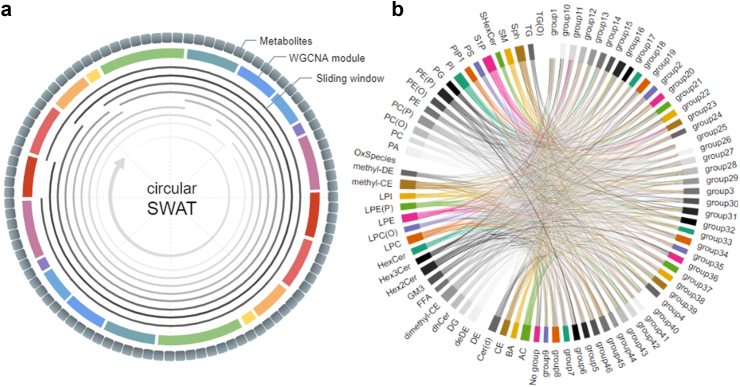
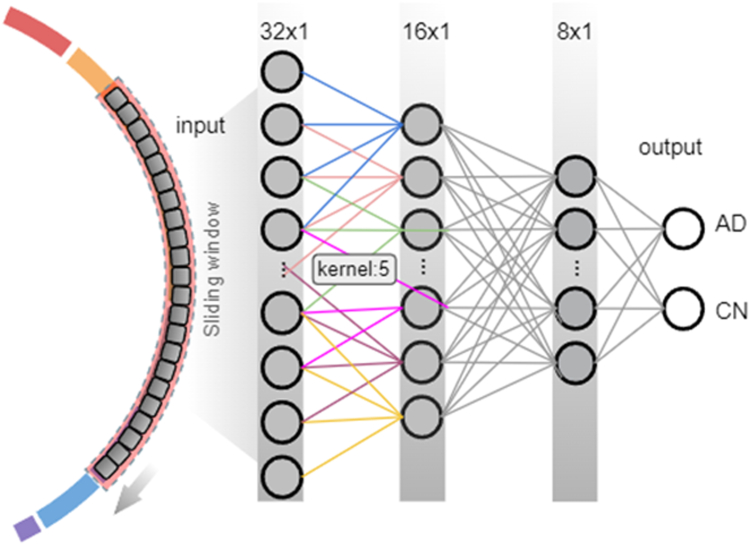
Methods: The c-SWAT methodology builds upon the existing Sliding Window Association Test (SWAT) and utilizes a three-step approach: feature correlation analysis, feature selection, and classification. Data from 997 participants from the Alzheimer's Disease Neuroimaging Initiative (ADNI) served as the basis for model training and validation. Feature correlations were analyzed using Weighted Gene Co-expression Network Analysis (WGCNA), and Convolutional Neural Networks (CNN) were employed for feature selection. Random Forest was used for the final classification.
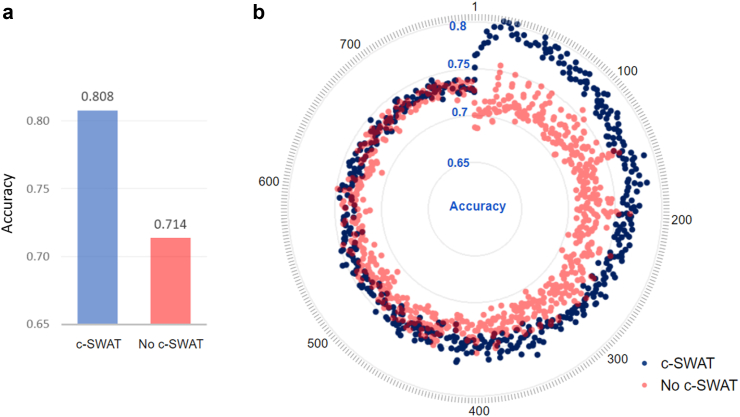
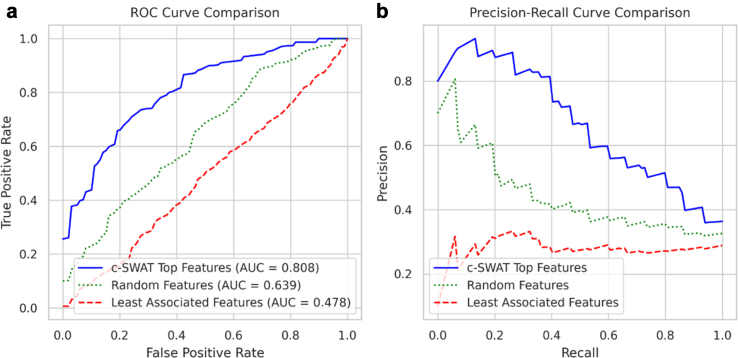
Findings: The application of c-SWAT resulted in a classification accuracy of up to 80.8% and an AUC of 0.808 for distinguishing AD from cognitively normal older adults. This marks a 9.4% improvement in accuracy and a 0.169 increase in AUC compared to methods without c-SWAT. These results were statistically significant, with a p-value of 1.04 × 10ˆ-4. The approach also identified key lipids associated with AD, such as Cer(d16:1/22:0) and PI(37:6).
Interpretation: Our results indicate that c-SWAT is effective in improving classification accuracy and in identifying potential lipid biomarkers for AD. These identified lipids offer new avenues for understanding AD and warrant further investigation.
Funding: The specific funding of this article is provided in the acknowledgements section.
Keywords: Alzheimer's disease; Deep learning; Lipidomics; Machine learning; Metabolomics.
Copyright © 2023 The Author(s). Published by Elsevier B.V. All rights reserved.
Conflict of interest statement
Declaration of interests Dr. Saykin receives support from multiple NIH grants (P30 AG010133, P30 AG072976, R01 AG019771, R01 AG057739, U19 AG024904, R01 LM013463, R01 AG068193, T32 AG071444, U01 AG068057, U01 AG072177, and U19 AG074879). He has also received support from Avid Radiopharmaceuticals, a subsidiary of Eli Lilly (in kind contribution of PET tracer precursor); Siemens Medical Solutions USA, Inc. (Dementia Advisory Board); NIH NHLBI (MESA Observational Study Monitoring Board); Eisai (Scientific Advisory Board); NIH/NIA: External Advisory Committees, Multiple NIH-funded centers/programs; and Springer-Nature Publishing (Editorial Office Support as Editor-in-Chief, Brain Imaging and Behavior). Dr. Kaddurah-Daouk receives support from multiple NIH grants (3U01AG061359, 1RF1AG059093, 1RF1AG058942, 5U19AG063744, 3U19AG063744-04S1, 1R01AG069901, 3U01AG061359-05S1). She is an inventor on a series of patents related to metabolomics signatures in neuropsychiatric diseases. Dr. Kaddurah-Daouk holds equity and stock in Metabolon, Inc., and PsyProtix, which were not involved in this study. Matthias Arnold is coinventor (through Duke University/Helmholtz Zentrum München) on patents on applications of metabolomics in diseases of the central nervous system. Matthias Arnold also holds equity in Chymia LLC and IP in PsyProtix and Atai that is unrelated to this work. The other authors declare no conflict of interest.
Figures
References
-
- LeCun Y., Bengio Y., Hinton G. Deep learning. Nature. 2015;521:436. - PubMed
-
- Jo T. Gilbut; 2019. Deep-learning for everyone.
-
- Schmidhuber J. Deep learning in neural networks: an overview. Neural Network. 2015;61:85–117. - PubMed
-
- Bengio Y., LeCun Y. Scaling learning algorithms towards AI. Large-scale kernel Machines. 2007;34(5):1–41.
MeSH terms
Substances
Grants and funding
- P30 AG072975/AG/NIA NIH HHS/United States
- R01 AG019771/AG/NIA NIH HHS/United States
- P30 AG066512/AG/NIA NIH HHS/United States
- U01 AG061356/AG/NIA NIH HHS/United States
- U01 AG024904/AG/NIA NIH HHS/United States
- U01 AG068057/AG/NIA NIH HHS/United States
- U19 AG063744/AG/NIA NIH HHS/United States
- U19 AG024904/AG/NIA NIH HHS/United States
- U01 AG061357/AG/NIA NIH HHS/United States
- P30 AG066462/AG/NIA NIH HHS/United States
- P30 AG010161/AG/NIA NIH HHS/United States
- RF1 AG059093/AG/NIA NIH HHS/United States
- P30 AG072977/AG/NIA NIH HHS/United States
- P30 AG072976/AG/NIA NIH HHS/United States
- P30 AG072972/AG/NIA NIH HHS/United States
- P30 AG066514/AG/NIA NIH HHS/United States
- RF1 AG058942/AG/NIA NIH HHS/United States
- T32 AG071444/AG/NIA NIH HHS/United States
- U01 AG046152/AG/NIA NIH HHS/United States
- U01 AG072177/AG/NIA NIH HHS/United States
- P30 AG010133/AG/NIA NIH HHS/United States
- U24 AG021886/AG/NIA NIH HHS/United States
- R01 AG069901/AG/NIA NIH HHS/United States
- R01 AG017917/AG/NIA NIH HHS/United States
- R01 AG057739/AG/NIA NIH HHS/United States
- U01 AG061359/AG/NIA NIH HHS/United States
- R01 AG068193/AG/NIA NIH HHS/United States
- R01 LM012535/LM/NLM NIH HHS/United States
- P30 AG072947/AG/NIA NIH HHS/United States
- R03 AG063250/AG/NIA NIH HHS/United States
- R01 LM013463/LM/NLM NIH HHS/United States
- R01 AG015819/AG/NIA NIH HHS/United States
LinkOut - more resources
Full Text Sources
Medical
Research Materials
Miscellaneous
