Environmental exposure disparities in ultrafine particles and PM2.5 by urbanicity and socio-demographics in New York state, 2013-2020
- PMID: 37806474
- PMCID: PMC12191151
- DOI: 10.1016/j.envres.2023.117246
Environmental exposure disparities in ultrafine particles and PM2.5 by urbanicity and socio-demographics in New York state, 2013-2020
Abstract
Background: The spatiotemporal and demographic disparities in exposure to ultrafine particles (UFP; number concentrations of particulate matter (PM) with diameter ≤0.1 μm), a key subcomponent of fine aerosols (PM2.5; mass concentrations of PM ≤ 2.5 μm), have not been well studied.
Objective: To quantify and compare the aerosol pollutant exposure disparities for UFP and PM2.5 by socio-demographic factors in New York State (NYS).
Methods: Ambient atmospheric UFP and PM2.5 were quantified using a global three-dimensional model of chemical transport with state-of-the-science aerosol microphysical processes validated extensively with observations. We matched these to U.S. census demographic data for varied spatial scales (state, county, county subdivision) and derived population-weighted aerosol exposure estimates. Aerosol exposure disparities for each demographic and socioeconomic (SES) indicator, with a focus on race-ethnicity and income, were quantified for the period 2013-2020.
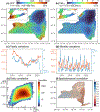
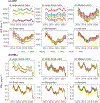
Results: The average NYS resident was exposed to 4451 #·cm-3 UFP and 7.87 μg·m-3 PM2.5 in 2013-2020, but minority race-ethnicity groups were invariably exposed to greater daily aerosol pollution (UFP: +75.0% & PM2.5: +16.2%). UFP has increased since 2017 and is temporally and seasonally out-of-phase with PM2.5. Race-ethnicity exposure disparities for PM2.5 have declined over time; by -6% from 2013 to 2017 and plateaued thereafter despite its decreasing concentrations. In contrast, these disparities have increased (+12.5-13.5%) for UFP. The aerosol pollution exposure disparities were the highest for low-income minorities and were more amplified for UFP than PM2.5. DISCUSSION: We identified large disparities in aerosol pollution exposure by urbanization level and socio-demographics in NYS residents. Jurisdictions with higher proportions of race-ethnicity minorities, low-income residents, and greater urbanization were disproportionately exposed to higher concentrations of UFP and PM2.5 than other NYS residents. These race-ethnicity exposure disparities were much larger, more disproportionate, and unabating over time for UFP compared to PM2.5 across various income strata and levels of urbanicity.
Keywords: Aerosols; Air quality; Environmental justice; Fine particulate matter; Public health inequalities; Ultrafine particles.
Copyright © 2023 The Authors. Published by Elsevier Inc. All rights reserved.
Conflict of interest statement
Declaration of competing interest The authors declare the following financial interests/personal relationships which may be considered as potential competing interests: Fangqun Yu reports financial support was provided by New York State Energy Research Development Authority. Shao Lin reports financial support was provided by National Institutes of Health.
Figures


Similar articles
-
Air pollution exposure in active versus passive travel modes across five continents: A Bayesian random-effects meta-analysis.Environ Res. 2024 Nov 15;261:119666. doi: 10.1016/j.envres.2024.119666. Epub 2024 Jul 27. Environ Res. 2024. PMID: 39074774
-
Comparing human exposure to fine particulate matter in low and high-income countries: A systematic review of studies measuring personal PM2.5 exposure.Sci Total Environ. 2022 Aug 10;833:155207. doi: 10.1016/j.scitotenv.2022.155207. Epub 2022 Apr 11. Sci Total Environ. 2022. PMID: 35421472 Free PMC article.
-
Fine Particulate Matter, Its Constituents, and Spontaneous Preterm Birth.JAMA Netw Open. 2024 Nov 4;7(11):e2444593. doi: 10.1001/jamanetworkopen.2024.44593. JAMA Netw Open. 2024. PMID: 39535795 Free PMC article.
-
Short-term effects of ultrafine particles on heart rate variability: A systematic review and meta-analysis.Environ Pollut. 2022 Dec 1;314:120245. doi: 10.1016/j.envpol.2022.120245. Epub 2022 Sep 23. Environ Pollut. 2022. PMID: 36162563
-
Long-term exposure to ambient O3 and PM2.5 is associated with reduced cognitive performance in young adults: A retrospective longitudinal repeated measures study in adults aged 18-90 years.Environ Pollut. 2023 Mar 1;320:121085. doi: 10.1016/j.envpol.2023.121085. Epub 2023 Jan 13. Environ Pollut. 2023. PMID: 36642175 Free PMC article.
Cited by
-
Hidden danger: The long-term effect of ultrafine particles on mortality and its sociodemographic disparities in New York State.J Hazard Mater. 2024 Jun 5;471:134317. doi: 10.1016/j.jhazmat.2024.134317. Epub 2024 Apr 15. J Hazard Mater. 2024. PMID: 38636229 Free PMC article.
-
Airborne Nanoparticle Concentrations Are Associated with Increased Mortality Risk in Canada's Two Largest Cities.Am J Respir Crit Care Med. 2024 Dec 1;210(11):1338-1347. doi: 10.1164/rccm.202311-2013OC. Am J Respir Crit Care Med. 2024. PMID: 38924496
-
Individual effects and interactions between ultrafine particles and extreme temperatures on hospital admissions of high burden diseases.Environ Int. 2025 Mar;197:109348. doi: 10.1016/j.envint.2025.109348. Epub 2025 Feb 23. Environ Int. 2025. PMID: 40020633 Free PMC article.
-
Equity in the Distribution of Regulatory PM2.5 Monitors.Environ Sci Technol. 2025 Aug 5;59(30):15843-15852. doi: 10.1021/acs.est.4c12915. Epub 2025 Jul 23. Environ Sci Technol. 2025. PMID: 40696896 Free PMC article.
References
-
- Alahmad B, Khraishah H, Royé D, Vicedo-Cabrera AM, Guo Y, Papatheodorou SI, Achilleos S, Acquaotta F, Armstrong B, Bell ML, Pan SC, 2023. Associations between extreme temperatures and cardiovascular Cause-specific mortality: results from 27 countries. Circulation 147 (1), 35–46. 10.1161/circulationaha.122.061832. - DOI - PMC - PubMed
-
- Bey I, Jacob DJ, Yantosca RM, Logan JA, Field BD, Fiore AM, Li Q, Liu HY, Mickley LJ, Schultz MG, 2001. Global modeling of tropospheric chemistry with assimilated meteorology: model description and evaluation. J. Geophys. Res. Atmos 106 (D19), 23073–23095. 10.1029/2001JD000807. - DOI
-
- Bond TC, Bhardwaj E, Dong R, Jogani R, Jung S, Roden C, Streets DG, Trautmann NM, 2007. Historical emissions of black and organic carbon aerosol from energy-related combustion, 1850–2000. Global Biogeochem. Cycles 21 (GB2018), 1–16. 10.1029/2006GB002840. - DOI
MeSH terms
Substances
Grants and funding
LinkOut - more resources
Full Text Sources
Medical

