. 2023 Dec:78:101821.
doi: 10.1016/j.molmet.2023.101821. Epub 2023 Oct 6.

Protective roles of adiponectin and molecular signatures of HNF4α and PPARα as downstream targets of adiponectin in pancreatic β cells

Affiliations

Protective roles of adiponectin and molecular signatures of HNF4α and PPARα as downstream targets of adiponectin in pancreatic β cells

Toshiharu Onodera et al. Mol Metab. 2023 Dec.

Abstract

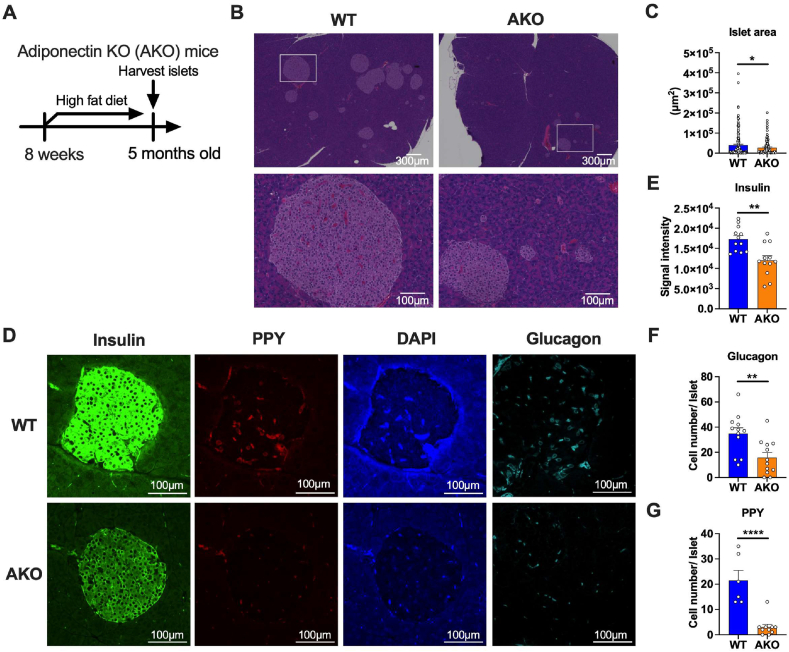
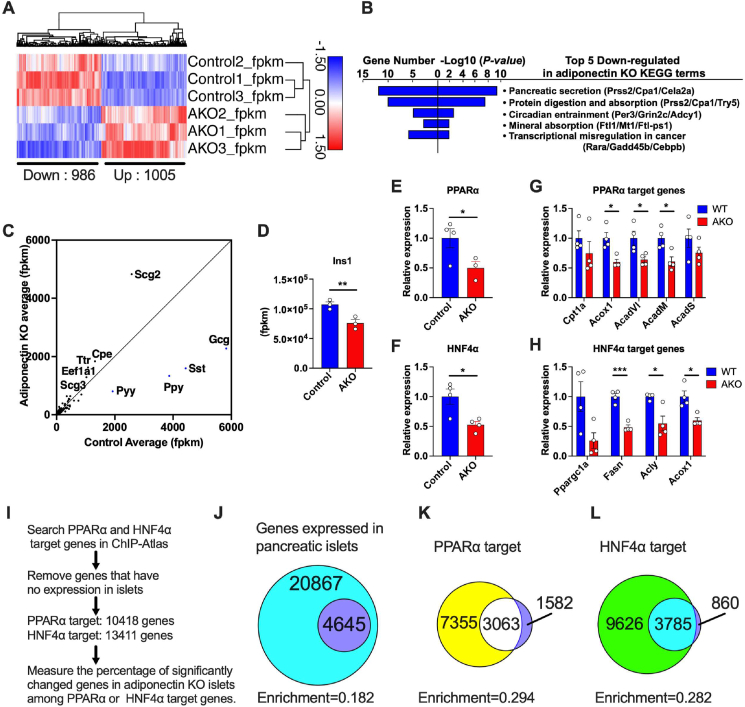
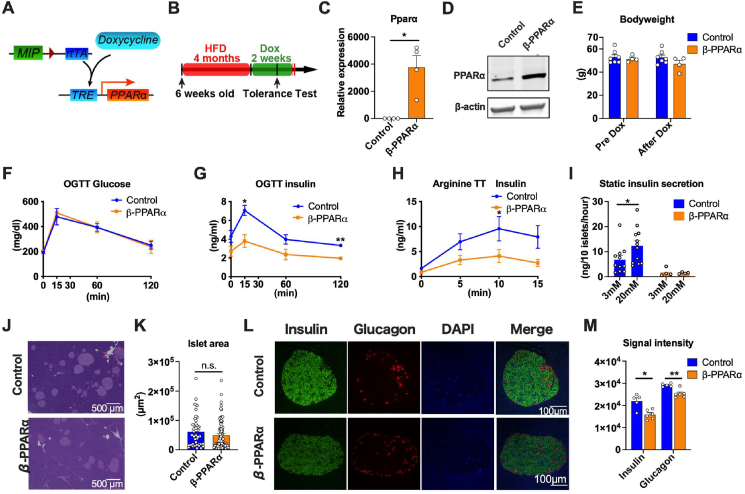
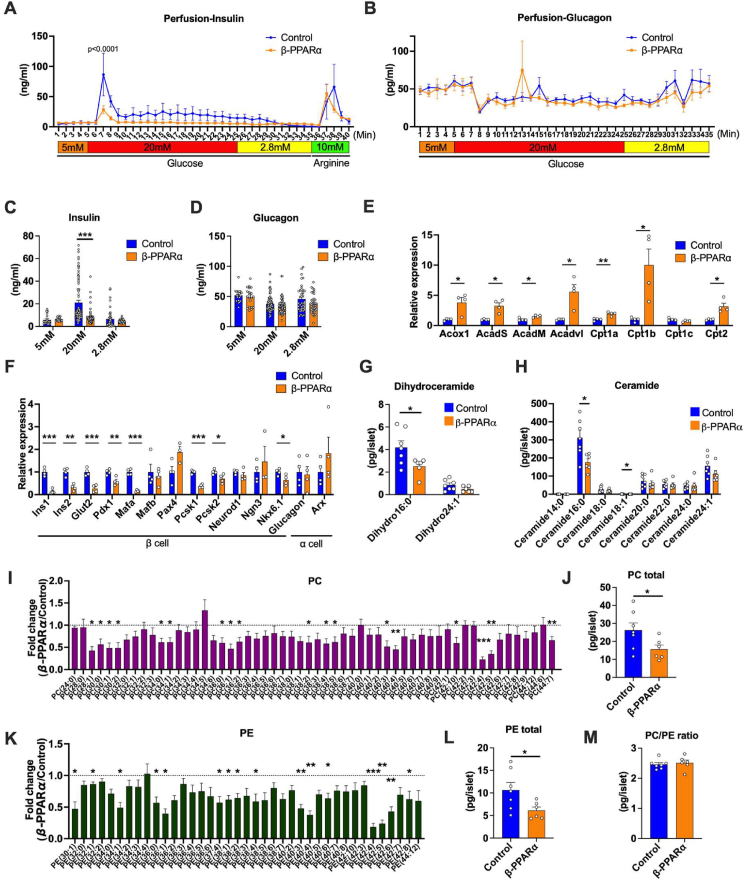
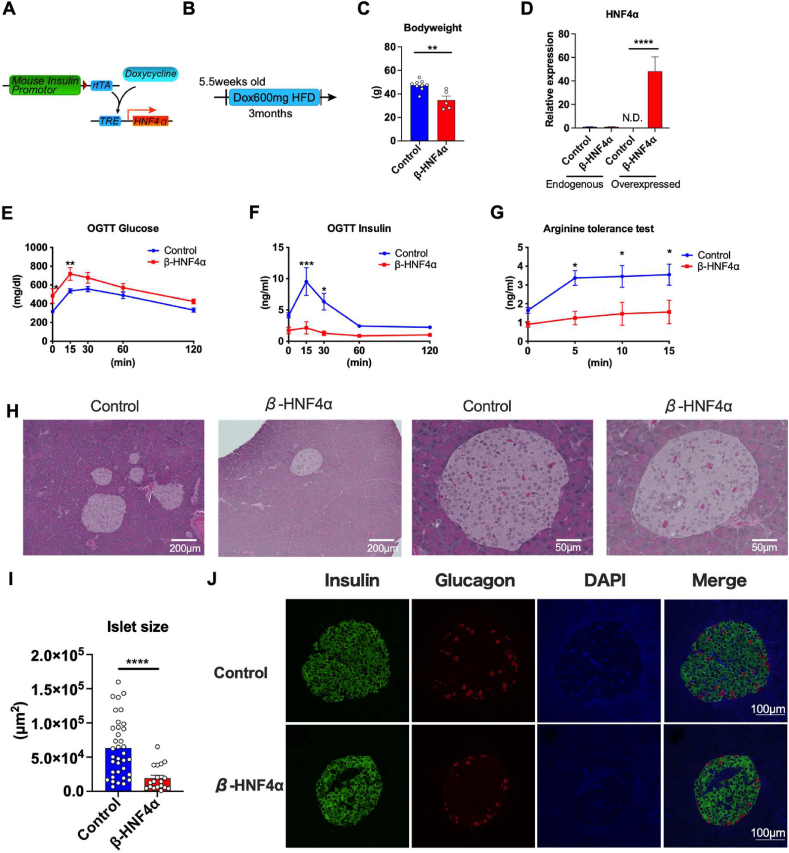
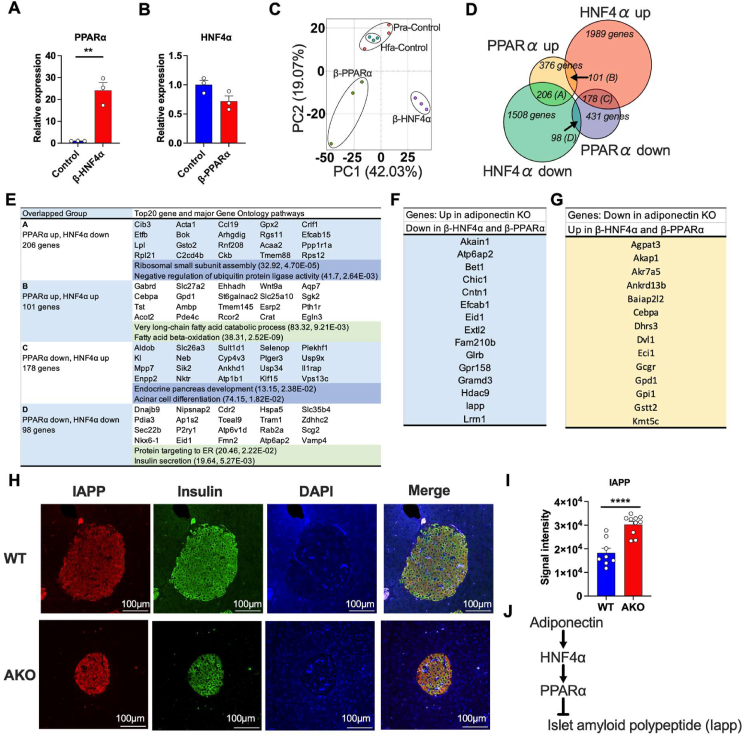
The disease progression of the metabolic syndrome is associated with prolonged hyperlipidemia and insulin resistance, eventually giving rise to impaired insulin secretion, often concomitant with hypoadiponectinemia. As an adipose tissue derived hormone, adiponectin is beneficial for insulin secretion and β cell health and differentiation. However, the down-stream pathway of adiponectin in the pancreatic islets has not been studied extensively. Here, along with the overall reduction of endocrine pancreatic function in islets from adiponectin KO mice, we examine PPARα and HNF4α as additional down-regulated transcription factors during a prolonged metabolic challenge. To elucidate the function of β cell-specific PPARα and HNF4α expression, we developed doxycycline inducible pancreatic β cell-specific PPARα (β-PPARα) and HNF4α (β-HNF4α) overexpression mice. β-PPARα mice exhibited improved protection from lipotoxicity, but elevated β-oxidative damage in the islets, and also displayed lowered phospholipid levels and impaired glucose-stimulated insulin secretion. β-HNF4α mice showed a more severe phenotype when compared to β-PPARα mice, characterized by lower body weight, small islet mass and impaired insulin secretion. RNA-sequencing of the islets of these models highlights overlapping yet unique roles of β-PPARα and β-HNF4α. Given that β-HNF4α potently induces PPARα expression, we define a novel adiponectin-HNF4α-PPARα cascade. We further analyzed downstream genes consistently regulated by this axis. Among them, the islet amyloid polypeptide (IAPP) gene is an important target and accumulates in adiponectin KO mice. We propose a new mechanism of IAPP aggregation in type 2 diabetes through reduced adiponectin action.

Keywords: Adiponectin; HNF4α; PPARα; β cell.


Conflict of interest statement

Declaration of Competing Interest The authors declare that they have no known competing financial interests or personal relationships that could have appeared to influence the work reported in this paper.

Figures

Figure 1
Figure 1
Adiponectin KO islets show decreased islet size, reduced number of glucagon+ cells and pancreatic polypeptide+ cells. (A) Adiponectin KO mice were fed with HFD from 8 weeks to 5 months old followed by harvesting pancreata and performing histology. (B) Representative H&E staining image of islets of adiponectin KO mice under HFD. The scale bar (white line) indicates 300 μm (upper panel) and 100 μm (lower panel), respectively. (C) Quantitation of islet areas (μm2). Dots represent areas of individual islets. n = 2, 5 fields were captured in each slide. (D) Immunofluorescence staining of adiponectin KO islets. Insulin (green), PPY (red), DAPI (blue) and Glucagon (Cyan). Glucagon image is derived from the separate section. Scale bar indicates 100 μm. (E) Quantitation of average signal intensity of insulin. Dots represent insulin signal intensity in each individual islet. N = 2, 3-6 fields were captured in each slide. (F) Quantitation of the number of glucagon+ cells in each islet. N = 2, 3-6 fields were captured in each slide. (G) Quantitation of the number of PPY+ cells in each islet. N = 2, 3-6 fields were captured in each slide. Data are mean ± SEM. ∗P < 0.05, ∗∗P < 0.01 and ∗∗∗∗P < 0.0001. Unpaired 2-tailed t-tests were utilized for determining the p-values for (C), (E), (F) and (G).
Figure 2
Figure 2
Adiponectin deficiency lowers endocrine pancreas function related genes, including PPARα and HNF4α expression in the islets. Adiponectin KO mice were fed with HFD starting at 8 weeks of age for 5 months followed by harvesting pancreatic islets. Total RNA was extracted from the islets and utilized for mRNA-sequencing (RNA-seq). (n = 3) (A) Hierarchical clustering of transcriptomes of wild type and adiponectin KO islets. (n = 3) The genes whose adjusted p-value are less than 0.05 among protein coding genes are shown in the heatmap. The number of up-regulated and down-regulated genes are described at the bottom of the heatmap. (B) The top 5 down-regulated pathways in adiponectin KO islets by KEGG pathway analysis. (n = 3) (C) Scatter plot of the RNA-seq. X-axis; the average of control fpkm, Y-axis; the average of adiponectin KO fpkm. (n = 3) (D) Ins1 expression in adiponectin KO islets. (n = 3) (E) PPARα expression in the adiponectin KO islets. (n = 3–4) (F) HNF4α expression in the adiponectin KO islets. (n = 4) (G) mRNA expressions of PPARα target genes. (n = 4) (H) mRNA expressions of HNF4α target genes. (n = 4) (I) The scheme of the procedure for analyzing the relationship between transcriptional targets and differentially expressed genes in adiponectin KO islets. (J) The Venn diagram representing the genes expressed in pancreatic islets (cyan + purple area) and differentially expressed genes in adiponectin KO islets (purple area). The enrichment is the proportion of purple area to whole genes expressed in islets (cyan + purple area). (K) The Venn diagram demonstrating the relationship between PPARα target genes (yellow + white area) and differentially expressed genes in adiponectin KO islets (white + purple area). The enrichment is the proportion of white area to PPARα target genes. (L) The Venn diagram demonstrating the relationship between HNF4α target genes (green + cyan area) and differentially expressed genes in adiponectin KO islets (cyan + purple area). The enrichment is the proportion of cyan area to HNF4α target genes. Data are presented as mean ± SEM. ∗P < 0.05, ∗∗P < 0.01 and ∗∗∗P < 0.001. Unpaired 2-tailed t-tests were utilized for determining the p-values for (D), (E), (F), (G) and (H).
Figure 3
Figure 3
Inducible PPARα overexpression in pancreatic β cells impairs insulin secretion.(A) The schematic representation of the Doxycycline-inducible PPARα overexpression in pancreatic β cells. rtTA is expressed under the control of mouse insulin promotor (MIP). Doxycycline promotes the binding of rtTA to TRE, that further activates the PPARα expression. Mip-rtTA mice were used as littermate controls. Mip-rtTA/TRE-PPARα were utilized as β cell PPARα overexpression (β- PPARα) mice (B) β- PPARα mice were fed with HFD for 4 months from 6 weeks old and switched to doxycycline 600 mg/kg containing HFD (Dox). Systemic tolerance tests were performed 2 weeks after the start of HFD Dox. (C) PPARα expression in the β- PPARα. (n = 4–5) (D) Representative Western blot image of PPARα in β- PPARα islets. (E) The body weight of β- PPARα mice before and after the treatment of HFD Dox. (n = 4–7) (F) The blood glucose levels during OGTT (n = 3–5) (G) The serum insulin level during OGTT (n = 3–5) (H) The serum insulin level during arginine tolerance test (n = 12) (I) GSIS of the islets from β-PPARα mice. (n = 4–12) (J) Representative H & E staining image of islets of control and β-PPARα mice. The scale bar (black line) indicates 500 μm. (K) Quantitation of islet areas. Dots represent individual area of islets. (n = 4) (L) Immunofluorescence of the β- PPARα pancreas. Insulin (green), Glucagon (red) and DAPI (blue). Scale bar indicates 100 μm. (M) Calculation of signal intensity of insulin and glucagon signal. (n = 5–6) Data are mean ± SEM. ∗P < 0.05 and ∗∗P < 0.01. 2-way ANOVA with Sidak's multiple comparison test was performed for (G) and (H). Unpaired 2-tailed t-tests were utilized for determining the p-values for (C), (I), (K) and (M).
Figure 4
Figure 4
Inducible PPARα overexpression in pancreatic β cells increases fatty acid oxidation and lowers ceramide content. (A) Insulin secretion rates (ng/ml) during the perfusion of β-PPARα mice pancreas. Glucose concentration was started with 5 mM followed by 20 mM and 2.8 mM (n = 4) (B) Glucagon secretion rates (pg/ml) during the perfusion of β-PPARα mice pancreas. (n = 4) (C) Average of the insulin secretion rates during the perfusion at each glucose concentration. (D) Average of the glucagon secretion rates during the perfusion at each glucose concentration. (E) Expressions of genes related to β oxidation in β-PPARα islets. (n = 4) (F) Expressions of genes related to β and α cell differentiation and function in β-PPARα islets. (n = 4) (G) Dihydroceramide species levels in β-PPARα islets. (n = 6–7) (H) Ceramide species levels in β-PPARα islets. (n = 6–7) (I) Fold-change of phosphatidylcholine (PC) content in β-PPARα islets over control islets. (n = 6–7) (J) Total PC levels in β-PPARα islets. (n = 6–7) (K) Fold change of phosphatidylethanolamine (PE) content in β-PPARα islets over control islets. (n = 6–7) (L) Total PE levels in β-PPARα islets. (M) PC/PE ratio in control and β-PPARα islets. (n = 6–7) Data are mean ± SEM. ∗P < 0.05, ∗∗P < 0.01 and ∗∗∗P < 0.001. 2-way ANOVA with Sidak's multiple comparison test was performed for (A) and (B). Unpaired 2-tailed t-tests were utilized for determining the p-values for (C), (E), (F), (G), (H), (I), (J), (K) and (L).
Figure 5
Figure 5
Inducible HNF4α overexpression in pancreatic β cells impairs the HFD-induced expansion of islets. (A) The schematic representation of the Doxycycline-inducible HNF4α overexpression in pancreatic β cells. rtTA is expressed under the control of mouse insulin promotor (MIP) that enables the pancreatic β cell specific overexpression. Doxycycline promotes the binding of rtTA to TRE, that further activates the PPARα expression. Mip-rtTA mice were used as littermate control. Mip-rtTA/TRE-HNF4α were utilized as β cell HNF4α overexpression (β-HNF4α) mice (B) β-HNF4α mice were fed with HFD Dox 600 mg/kg from 5.5 weeks old for 3 months followed by the systemic tolerance test. (C) The body weight of β-HNF4α mice after 3 months of HFD Dox feeding. (n = 5–9) (D) The expressions of genes of endogenous HNF4α and HNF4α transgene in control and β-HNF4α mice islet. (n = 3) (E) Blood glucose level of β-HNF4α mice during OGTT (n = 5–9) (F) Serum insulin level of β-HNF4α mice during OGTT (n = 3–6) (G) Serum insulin level of β-HNF4α mice during arginine tolerance test (n = 11–6) (H) Representative H & E staining image of islets of control and β-HNF4α mice. The scale bar (white line) indicates 200 μm for low-magnification images and 50 μm for high-magnification images. (I) Quantitation of islet areas. Dots represent individual area of islets in β-HNF4α pancreata. n = 4 (J) Immunofluorescence of the β-HNF4α pancreas. Insulin (green), Glucagon (red) and DAPI (blue). Scale bar indicates 100 μm. Data are mean ± SEM. ∗P < 0.05, ∗∗P < 0.01, ∗∗∗P < 0.001 and ∗∗∗∗P < 0.0001. 2-way ANOVA with Sidak's multiple comparison test was performed for (E), (F) and (G). Unpaired 2-tailed t-tests were utilized for determining the p-values for (C), (D) and (I).
Figure 6
Figure 6
Gene signatures of β-PPARα and β-HNF4α islets exhibit the potential pathways of adiponectin actions on pancreatic islets.(A) PPARα mRNA expression in β-HNF4α pancreatic islets. (n = 3) (B) HNF4α mRNA expression in β-PPARα pancreatic islets. (n = 3) (C) Principal component analysis of transcriptome signatures of β-PPARα and β-HNF4α pancreatic islets. (D) Overlap of the significantly up-regulated or down-regulated genes in β-PPARα and β-HNF4α pancreatic islets. (E) The major GO pathways and GO pathways highly affected by β-PPARα and β-HNF4α overexpression in each group. The numbers in the brackets describe fold-enrichment and FDR, respectively. (F) The list of genes that was significantly up-regulated in adiponectin KO islets but down-regulated in β-PPARα and β-HNF4α pancreatic islets. (G) The list of genes that was significantly down-regulated in adiponectin KO islets but up-regulated in β-PPARα and β-HNF4α pancreatic islets. (H) Representative image of immunofluorescence of the adiponectin KO pancreas. IAPP (red), Insulin (green) and DAPI (blue). Scale bar indicates 100 μm. (I) The calculation of the average signal intensity of IAPP immunofluorescence. (n = 8–10) (J) The schematic representation of potential adiponectin action cascade on the pancreatic islets through HNF4α and PPARα. Data are mean ± SEM. ∗∗P < 0.01 and ∗∗∗∗P < 0.0001. Unpaired 2-tailed t-tests were utilized for determining the p-values for (A) and (I).

Similar articles

Cited by

References

    1. Poitout V., Robertson R.P. Minireview: secondary beta-cell failure in type 2 diabetes--a convergence of glucotoxicity and lipotoxicity. Endocrinology. 2002;143(2):339–342. - PubMed
    1. Poitout V., Amyot J., Semache M., Zarrouki B., Hagman D., Fontes G. Glucolipotoxicity of the pancreatic beta cell. Biochim Biophys Acta. 2010;1801(3):289–298. - PMC - PubMed
    1. Wang H., Kouri G., Wollheim C.B. ER stress and SREBP-1 activation are implicated in beta-cell glucolipotoxicity. J Cell Sci. 2005;118(Pt 17):3905–3915. - PubMed
    1. Shimabukuro M., Zhou Y.T., Levi M., Unger R.H. Fatty acid-induced beta cell apoptosis: a link between obesity and diabetes. Proc Natl Acad Sci U S A. 1998;95(5):2498–2502. - PMC - PubMed
    1. Busch A.K., Cordery D., Denyer G.S., Biden T.J. Expression profiling of palmitate- and oleate-regulated genes provides novel insights into the effects of chronic lipid exposure on pancreatic beta-cell function. Diabetes. 2002;51(4):977–987. - PubMed