. 2023 Nov 2;146(11):4702-4716.
doi: 10.1093/brain/awad284.

Identification of different MRI atrophy progression trajectories in epilepsy by subtype and stage inference

Affiliations

Identification of different MRI atrophy progression trajectories in epilepsy by subtype and stage inference

Fenglai Xiao et al. Brain. .

Abstract

Artificial intelligence (AI)-based tools are widely employed, but their use for diagnosis and prognosis of neurological disorders is still evolving. Here we analyse a cross-sectional multicentre structural MRI dataset of 696 people with epilepsy and 118 control subjects. We use an innovative machine-learning algorithm, Subtype and Stage Inference, to develop a novel data-driven disease taxonomy, whereby epilepsy subtypes correspond to distinct patterns of spatiotemporal progression of brain atrophy.In a discovery cohort of 814 individuals, we identify two subtypes common to focal and idiopathic generalized epilepsies, characterized by progression of grey matter atrophy driven by the cortex or the basal ganglia. A third subtype, only detected in focal epilepsies, was characterized by hippocampal atrophy. We corroborate external validity via an independent cohort of 254 people and confirm that the basal ganglia subtype is associated with the most severe epilepsy.Our findings suggest fundamental processes underlying the progression of epilepsy-related brain atrophy. We deliver a novel MRI- and AI-guided epilepsy taxonomy, which could be used for individualized prognostics and targeted therapeutics.

Keywords: MRI; brain atrophy; disease progression; epilepsy; subtype and stage inference.


Conflict of interest statement

The authors report no competing interests.

Figures

Figure 1
Figure 1
Visual schematic of the SuStaIn event-based model. We applied the SuStaIn algorithm to derive spatiotemporal patterns of progression of atrophy in large samples of people with focal epilepsy and IGE (n = 1299). The three main steps of the algorithm consist of: (A) Model input: selection of regions of interest, adjustment for nuisance variables, and conversion of regional grey matter metrics into z-scores relative to healthy control data; (B) Model fitting: computation of the best-fit probability distributions for normal and atrophic brain regions, identification of the most likely progression sequence, and quantification of uncertainty with cross-validation. An illustrative positional variance diagram, displayed on the left-hand side, shows an example of an atrophy progression sequence with the highest likelihood on the y-axis, and the number of model stages (i.e. sequence positions) on the x-axis; the intensity of each entry corresponds to the proportion of Markov Chain Monte Carlo samples for which a certain region of the y-axis appears at the respective stage of the x-axis. An exemplary ternary plot shows the probability with which each individual is assigned to a given subtype, whereby each vertex represents the point at which membership of a given subtype is maximal (100%). The dots correspond to individual data and are labelled by final subtype classification: subtype 1, subtype 2 or subtype 3. (C) External validation: repetition of procedures detailed in passages A and B for the external validation cohort, to address generalizability.
Figure 2
Figure 2
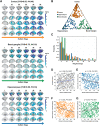
MRI-based progression subtypes in focal epilepsy: discovery cohort. The figure shows the spatiotemporal patterns of progression of grey matter atrophy (A: subtypes: cortical; basal ganglia; hippocampal) identified via SuStaIn in the focal epilepsy discovery cohort. Each of the three progression patterns in A consists of a sequence of stages with which cortical thickness and subcortical volumes reach different z-scores in people with epilepsy relative to healthy control subjects. The shading of each region indicates the severity of grey matter loss; white represents unaffected areas; light shading represents mildly affected areas (z-score = 1–2); medium shading represents moderately affected areas (z-score = 2–3); and dark shading represents severely affected areas (z-score >3). CVS = cross-validation similarity; f = proportion of participants assigned to each subtype. (B) The assignability of the disease subtype, operationalized as the distance from each vertex of the triangle, whereby each vertex represents the point at which membership of a given subtype is maximal (100%). Each participant was assigned to one subtype (cortical, basal ganglia or hippocampal) based on the maximum likelihood of subtype expression (cut-off value: > 50%). (C) The probability with which each participant from the focal epilepsy discovery cohort was assigned a specific SuStaIn stage (stage ranges: 0.002–62.424). (D) The correlation between duration of epilepsy and weighted stage. (E) A negative correlation is shown between within-individual expression of hippocampal subtype and a marker of well controlled epilepsy [principal component (PC2); see main text]. (F and G) Panels show the correlations between within-individual expression of cortical and basal ganglia subtypes and a marker of poorly controlled epilepsy (PC1). Correlation analyses were conducted with Spearman’s ρ; the associated panels show ranked data; Sigma (standard deviation), a measure of the spread of a dataset, is used to represent the variability of the data. SuStaIn = subtype and stage inference.
Figure 3
Figure 3
MRI-based progression subtypes in focal epilepsy: validation cohort. The figure shows the spatiotemporal patterns of progression of grey matter atrophy (A: subtypes: cortical; basal ganglia; hippocampal) identified via SuStaIn in the focal epilepsy validation cohort. Each of the three progression patterns in A consists of a sequence of stages with which cortical thickness and subcortical volumes reach different z-scores in patients relative to healthy control subjects. The shading of each region indicates the severity of grey matter loss; white represents unaffected areas; light shading represents mildly affected areas (z-score = 1–2); shading represents moderately affected areas (z-score = 2–3); and dark shading represents severely affected areas (z-score >3). CVS = cross-validation similarity; f = proportion of participants assigned to each subtype. (B) The assignability of the disease subtype, operationalized as the distance from each vertex of the triangle, whereby each vertex represents the point at which membership of a given subtype is maximal (100%). Each participant was assigned to one subtype (cortical, basal ganglia or hippocampal) based on the maximum likelihood of subtype expression (cut-off value: >50%). (C) The probability with which each participant from the focal epilepsy discovery cohort was assigned a specific SuStaIn stage (stage ranges: 0.006–54.008). (D) The correlation between duration of epilepsy and weighted stage (Spearman’s ρ = 0.268, P = 0.008), with an increasing weighted stage relating to longer disease duration; the associated panels show ranked data. (EG) The not significantly important correlation is shown between a marker of poorly controlled epilepsy (PC1) with within-individual expression of hippocampal, cortical and basal ganglia subtypes. Correlation analyses were conducted with Spearman’s ρ; the associated panels show ranked data; Sigma (standard deviation), a measure of the spread of a dataset, is used to represent the variability of the data. SuStaIn = subtype and stage inference.
Figure 4
Figure 4
MRI-based progression subtypes in IGE: discovery cohort. The figure shows the spatiotemporal patterns of progression of grey matter atrophy (A: subtypes; cortical; basal ganglia) identified via SuStaIn in the IGE discovery cohort. (A) The colour of each region indicates the severity of grey matter loss; white represents unaffected areas; light shading represents mildly affected areas (z-score = 1–2); medium shading represents moderately affected areas (z-score = 2–3); and dark shading represents severely affected areas (z-score >3). CVS = cross-validation similarity; f = proportion of participants assigned to each subtype. (B) The assignability of the disease subtype, operationalized as the distance from each side of the bar, whereby each vertex represents the point at which membership of a given subtype is maximal (100%). (C) The probability with which each participant from the IGE discovery cohort was assigned a specific SuStaIn stage (stage ranges: 0.005–39.384). (D) The correlation between duration of epilepsy and weighted stage, which was not significant. (E and F) The correlations between within-individual expression of cortical and basal ganglia subtypes and a marker of poorly controlled IGE (PC1), which were not significant. (G and H) The correlations between within-individual expression of cortical and basal ganglia subtypes and a marker of well controlled IGE (PC2). Correlation analyses were conducted with Spearman’s ρ; the associated panels show ranked data; Sigma (standard deviation), a measure of the spread of a dataset, is used to represent the variability of the data. SuStaIn = subtype and stage inference.
Figure 5
Figure 5
MRI-based progression subtypes in IGE: validation cohort. The figure shows the spatiotemporal patterns of progression of grey matter atrophy (A: subtypes; cortical; basal ganglia) identified via SuStaIn in the IGE validation cohort. (A) The shading of each region indicates the severity of grey matter loss; white represents unaffected areas; light shading represents mildly affected areas (z-score = 1–2); medium shading represents moderately affected areas (z-score = 2–3); and dark shading represents severely affected areas (z-score >3). CVS = cross-validation similarity. f = proportion of participants assigned to each subtype. (B) The assignability of the disease subtype, operationalized as the distance from each side of the bar, whereby each vertex represents the point at which membership of a given subtype is maximal (100%). (C) The probability with which each participant from the IGE discovery cohort was assigned a specific SuStaIn stage (stage ranges: 0.004–53.981). (D) The correlation between duration of epilepsy and weighted stage (Spearman’s ρ), which was not statistically significant; the associated panels show ranked data. (E and F) The (not significant) correlation between a marker of poorly controlled epilepsy (PC) with within-individual expression of cortical and basal ganglia subtypes. Correlation analyses were conducted with Spearman’s ρ; the associated panels show ranked data; Sigma (standard deviation), a measure of the spread of a dataset, is used to represent the variability of the data. IGE = idiopathic generalized epilepsy; SuStaIn = subtype and stage inference.

Comment in

References

    1. Devinsky O, Vezzani A, O'Brien TJ, et al. Epilepsy. Nat Rev Dis Primers. 2018;4:18024. - PubMed
    1. Fisher RS, Cross JH, French JA, et al. Operational classification of seizure types by the international league against epilepsy: Position paper of the ILAE commission for classification and terminology. Epilepsia. 2017;58:522–530. - PubMed
    1. Scheffer IE, Berkovic S, Capovilla G, et al. ILAE Classification of the epilepsies: Position paper of the ILAE commission for classification and terminology. Epilepsia. 2017;58:512–521. - PMC - PubMed
    1. Hirsch E, French J, Scheffer IE, et al. ILAE Definition of the idiopathic generalized epilepsy syndromes: Position statement by the ILAE task force on nosology and definitions. Epilepsia. 2022;63:1475–1499. - PubMed
    1. Thijs RD, Surges R, O’Brien TJ, Sander JW. Epilepsy in adults. Lancet. 2019;393:689–701. - PubMed

Publication types