. 2023;43(10):531-546.
doi: 10.1080/10985549.2023.2253131. Epub 2023 Oct 11.

Mitochondrial Fragmentation Promotes Inflammation Resolution Responses in Macrophages via Histone Lactylation

Affiliations

Mitochondrial Fragmentation Promotes Inflammation Resolution Responses in Macrophages via Histone Lactylation

Leah I Susser et al. Mol Cell Biol. 2023.

Abstract

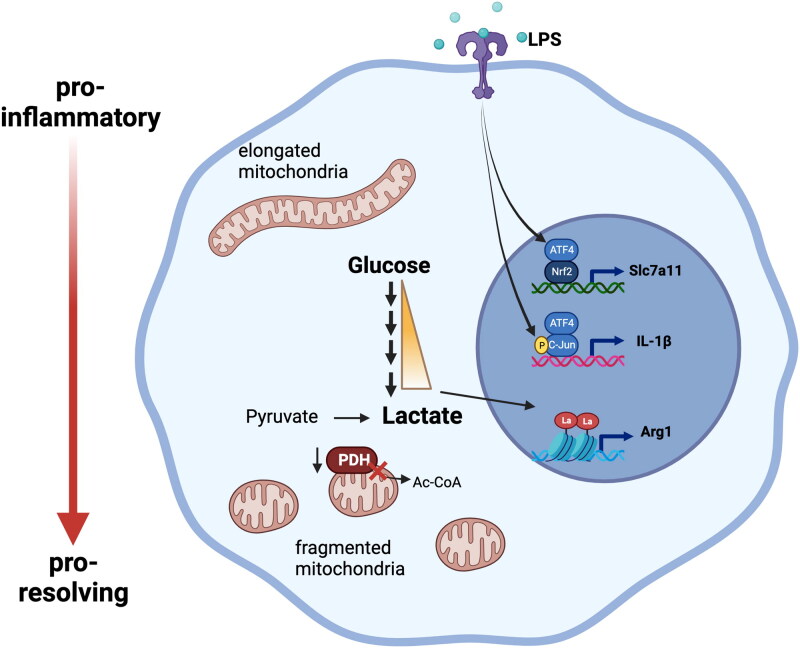
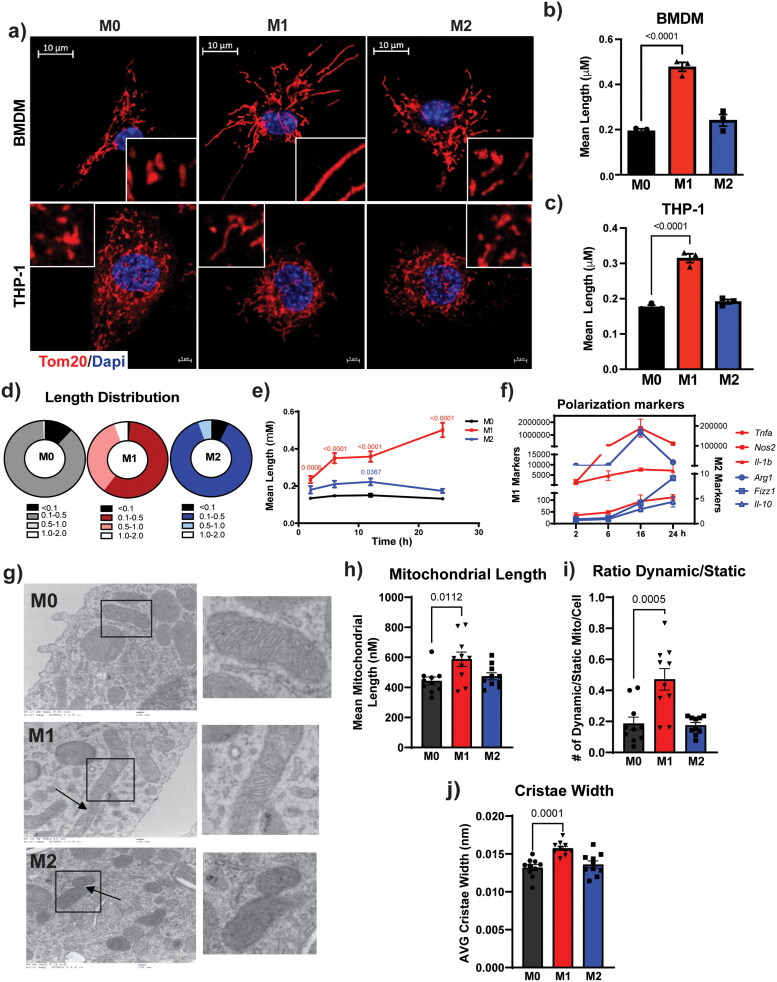
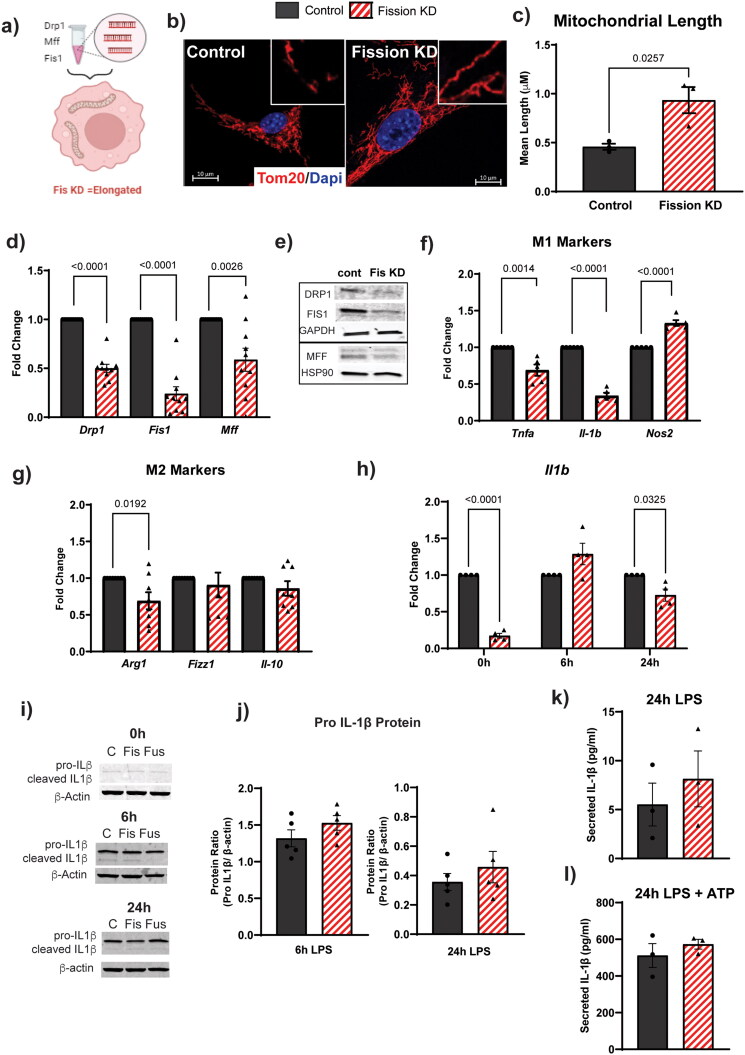
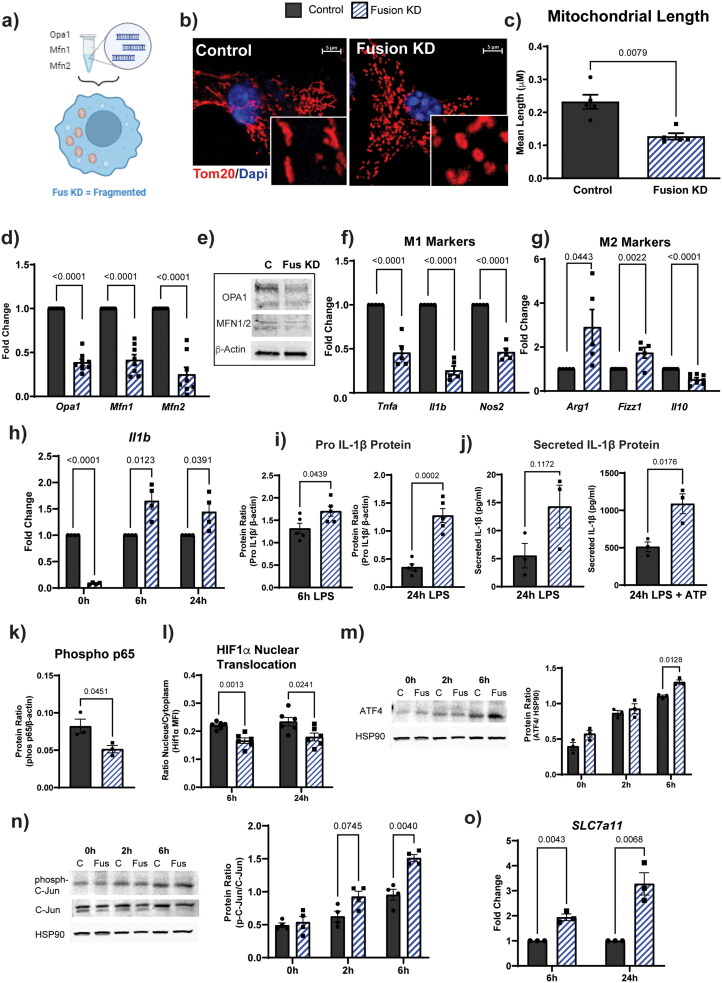
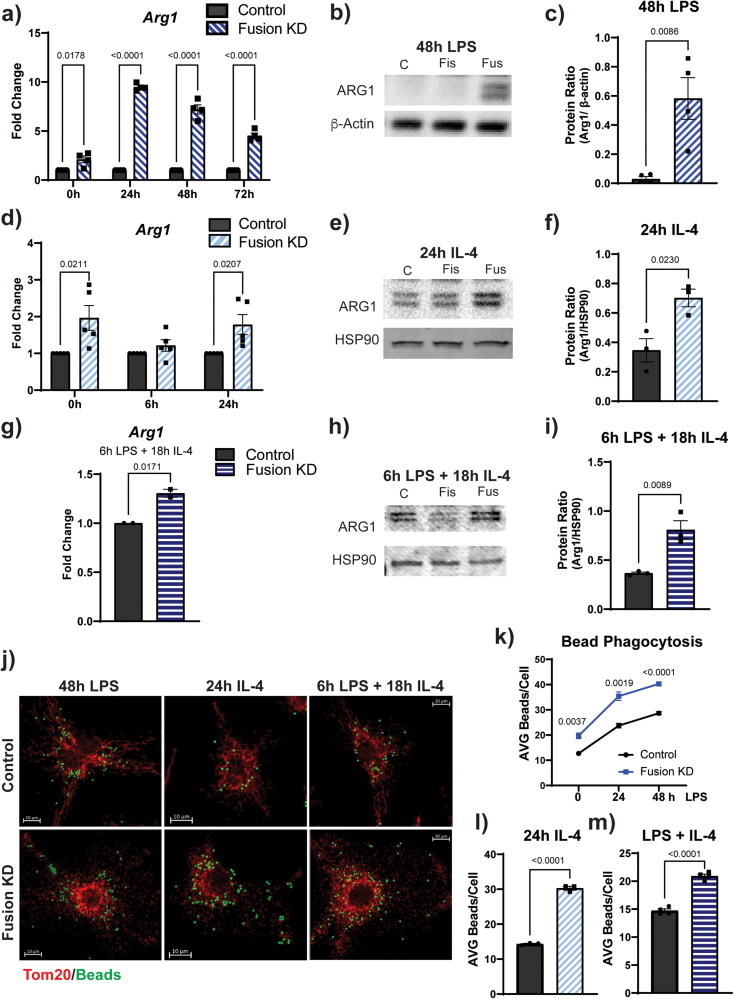
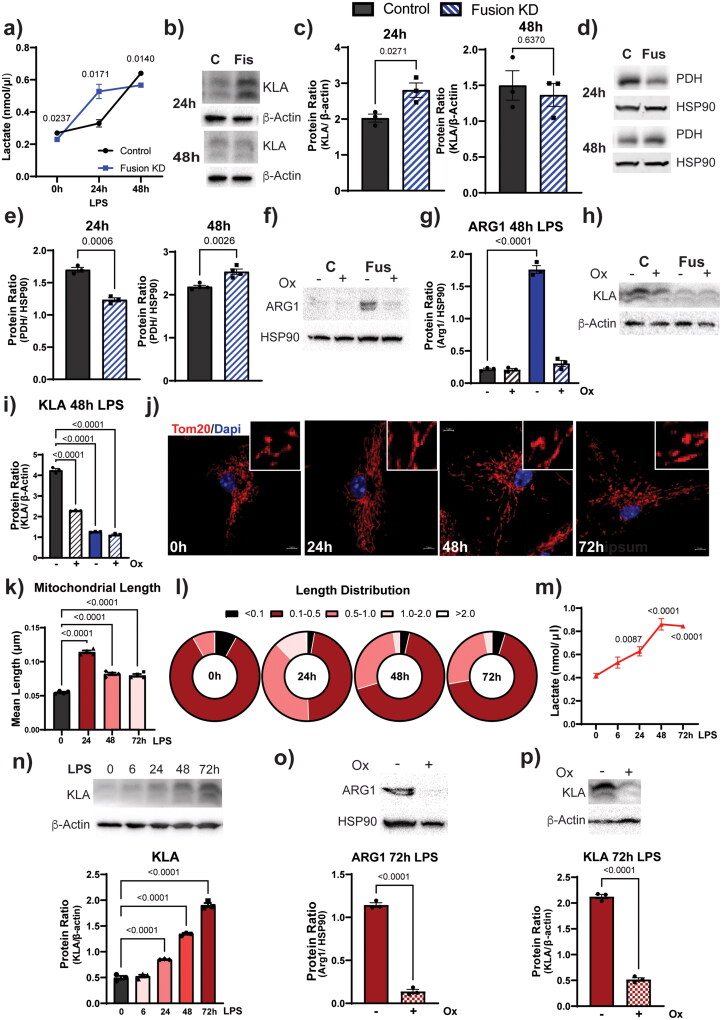
During the inflammatory response, macrophage phenotypes can be broadly classified as pro-inflammatory/classically activated "M1", or pro-resolving/alternatively "M2" macrophages. Although the classification of macrophages is general and assumes there are distinct phenotypes, in reality macrophages exist across a spectrum and must transform from a pro-inflammatory state to a proresolving state following an inflammatory insult. To adapt to changing metabolic needs of the cell, mitochondria undergo fusion and fission, which have important implications for cell fate and function. We hypothesized that mitochondrial fission and fusion directly contribute to macrophage function during the pro-inflammatory and proresolving phases. In the present study, we find that mitochondrial length directly contributes to macrophage phenotype, primarily during the transition from a pro-inflammatory to a proresolving state. Phenocopying the elongated mitochondrial network (by disabling the fission machinery using siRNA) leads to a baseline reduction in the inflammatory marker IL-1β, but a normal inflammatory response to LPS, similar to control macrophages. In contrast, in macrophages with a phenocopied fragmented phenotype (by disabling the fusion machinery using siRNA) there is a heightened inflammatory response to LPS and increased signaling through the ATF4/c-Jun transcriptional axis compared to control macrophages. Importantly, macrophages with a fragmented mitochondrial phenotype show increased expression of proresolving mediator arginase 1 and increased phagocytic capacity. Promoting mitochondrial fragmentation caused an increase in cellular lactate, and an increase in histone lactylation which caused an increase in arginase 1 expression. These studies demonstrate that a fragmented mitochondrial phenotype is critical for the proresolving response in macrophages and specifically drive epigenetic changes via lactylation of histones following an inflammatory insult.

Keywords: fission; fusion; histone lactylation; inflammation resolution; macrophages; mitochondrial metabolism.


Conflict of interest statement

No potential conflict of interest was reported by the author(s).

Figures

None
Graphical abstract
FIG 1
FIG 1
Elongated mitochondria are associated with a pro-inflammatory macrophage phenotype. BMDM or THP1 cells were differentiated and then polarized for 24 h before being fixed and analyzed by microscopy. (a) Representative immunofluorescence (IF) microscopy of polarized macrophages mitochondrial network (Tom20 in red and DAPI in blue). (b) Quantification of BMDM mitochondrial length measured manually on ImageJ (n = 3). (c) Quantification of THP1 mitochondrial length measured manually on ImageJ (n = 3). (d) Distribution of mitochondrial length across polarization (n = 3). (e) Quantification of mitochondrial length over time (n = 3). (f) Gene expression of M1 and M2 markers over time (n = 10). (g) Representative transmission electron microscopy (TEM) images of M0, M1 and M2 BMDMs. (h) Quantification of average mitochondrial length (n = 10). (i) Ratio of dynamic over static mitochondria with dynamic events defined as membrane pinching examples indicated by arrows (n = 10). (j) Quantification of average cristae width (n = 10). Data are presented as the mean of biological replicates ± SEM. Statistical analysis by one-way ANOVA.
FIG 2
FIG 2
Knocking down the mitochondrial fission machinery does not alter the IL-1β inflammatory pathway. BMDMs were transfected with siRNA against all three fission proteins or an equal concentration of scrambled control siRNA for 72 h. (a) Infographic of fission KD by siRNA transfection. (b) Representative IF microscopy of control vs fission KD cells mitochondrial network (Tom20 in red and DAPI in blue). (c) Quantification of average mitochondrial length per cell (n = 3). (d) Quantification of fission knockdown (KD) efficiency by qPCR (n = 9). (e) Verification of fission KD by Western blot (DRP1 27 kDa, FIS1 17 kDa, MFF 38 kDa, GAPDH 36 kDa, and HSP90 90 kDa). (f) Effect of fission KD on M1 marker gene expression (n = 5). (g) Effect of fission KD on M2 marker gene expression (n = 8). (h) Il-1b gene expression upon LPS stimulation in fission KD cells (n = 4). (i) Representative Western blot of IL-1β upon LPS stimulation (IL-1β 35, 29 kDa, β-Actin 45 kDa). (j) Quantification of fission KD effect on IL-1β protein upon LPS stimulation normalized to β-Actin (n = 5). (k) Secreted IL-1β levels in fission KD cells upon 24 h LPS stimulation measured by ELISA (n = 3). (l) Secreted IL-1β levels in fission KD cells upon 24 h LPS + 30 min ATP stimulation measured by ELISA (n = 3). Data are presented as the mean of biological replicates ± SEM. Statistical analysis by unpaired Student’s t test except for h where multiple unpaired t tests with Holm–Šídák correction were applied.
FIG 3
FIG 3
Impairing mitochondrial fusion augments IL-1β and ATF-4/c-Jun pathway. BMDMs were transfected with siRNA against all three fusion proteins or an equal concentration of scrambled control siRNA for 72 h. (a) Infographic of fusion KD by siRNA transfection. (b) Representative IF microscopy of control vs fusion KD cells mitochondrial network (Tom20 in red and DAPI in blue). (c) Quantification of average mitochondrial length per cell (n = 5). (d) Quantification of fusion knockdown (KD) efficiency by qPCR (n = 10). (e) Verification of fusion KD by Western blot (OPA1 86, 92 kDa, MFN1/2 75 kDa, and β-actin 45 kDa). (f) Effect of fusion KD on M1 marker gene expression (n = 5). G) Effect of fusion KD on M2 Marker gene expression (n = 5). H) Il-1b gene expression upon LPS stimulation in fusion KD cells (n = 4). (i) Quantification of fusion KD pro-IL-1β protein levels normalized to β-Actin upon 6 and 24 h of LPS stimulation (n = 5). (j) Secreted IL-1β levels in fusion KD cells upon 24 h LPS stimulation with and without 30 min ATP measured by ELISA (n = 3). (k) Quantification of phosphorylated p65 (NFκB) protein normalized to β-Actin after 24 h of LPS stimulation (n = 3). (l) HIF1α nuclear translocation as measured by IF microscopy upon LPS stimulation (n = 6.) (m) Representative Western blot of ATF4 upon LPS stimulation (ATF4 49 kDa & HSP90 90 kDa) and quantification (n = 3). n) Representative western blot of c-Jun and phosphorylated c-Jun upon LPS stimulation (c-Jun 43, 48 kDa, Phos c-Jun 48 kDa, HSP90 90 kDa) and quantification (n = 4). (o) Slc7a11 gene expression upon LPS stimulation in fusion KD cells (n = 4). Data are presented as the mean of biological replicates ± SEM. Statistical analysis by unpaired Student’s t test except for h and l-o, where multiple unpaired t tests with Holm–Šídák correction were applied.
FIG 4
FIG 4
Silencing mitochondrial fusion machinery promotes a proresolving macrophage phenotype. (a) Arg1 gene expression over time upon LPS stimulation (n = 4). (b) Representative ARG1 Western blot after 48 h of LPS stimulation. (c) Quantification of ARG1 protein levels normalized to β-Actin after 48 h LPS stimulation (n = 4). (d) Arg1 gene expression over time upon IL-4 stimulation (n = 5). (e) Representative ARG1 Western blot after 24 h of IL-4 stimulation. (f) Quantification of ARG1 protein levels normalized to HSP90 after 24 h IL-4 stimulation (n = 3). (g) Arg1 gene expression upon 6 h LPS + 18 h IL-4 stimulation (n = 2). (h) Representative ARG1 Western blot after 6 h LPS + 18 h IL-4 stimulation. (i) Quantification of ARG1 protein levels normalized to HSP90 after 6 h LPS + 18 h IL-4 stimulation (n = 3). (j) Representative immunofluorescence microscopy of bead phagocytosis (Tom20 in red and beads in green). (k) Quantification of bead phagocytosis in fusion KD cells under LPS stimulation (n = 4). (l) Quantification of bead phagocytosis in fusion KD cells under IL-4 stimulation (n = 3). (m) Quantification of bead phagocytosis in fusion KD cells under 6 h LPS + 18 h IL-4 stimulation (n = 4). Western blot molecular weights ARG1 40 kDa, β-Actin 45 kDa, HSP90 90 kDa. Data are presented as the mean of biological replicates ± SEM. Statistical analysis c, f, g, i, l, m by unpaired Student’s t test and a, d, k by multiple unpaired t tests with Holm–Šídák correction.
FIG 5
FIG 5
Silencing mitochondrial fusion machinery alters cellular lactate levels, increases histone lactylation and reduces PDH. (a) Lactate levels over time in fusion KD cells compared to control cells (n = 3). (b) Representative Western blot of histone lactylation (KLA) over time. (c) Quantification KLA in fusion KD cells after 24 and 48 h LPS stimulation (n = 3). (d) Representative Western blot of pyruvate dehydrogenase levels over time. (e) Quantification PDH in fusion KD cells after 24 and 48 h LPS stimulation (n = 3). (f) Representative Western blot of ARG1 in control vs fusion KD cells upon 48 h LPS stimulation with LDH inhibitor sodium oxamate. (g) Quantification ARG1 in fusion KD cells after 48 h LPS stimulation with sodium oxamate (n = 3). (h) Representative Western blot of KLA in control vs fusion KD cells upon 48 h LPS stimulation with sodium oxamate. (i) Quantification KLA in fusion KD cells after 48 h LPS stimulation with sodium oxamate (n = 3). j) Representative images of mitochondrial network morphology upon late-stage LPS stimulation (Tom20 in red and DAPI in blue). (k) Quantification of average mitochondrial length per cell (n = 4) (l) Average mitochondrial length distribution per time point (n = 4). (m) Lactate levels upon LPS stimulation in control cells with statistics vs 0h (n = 3). (n) Representative time course Western blot of histone lactylation (KLA) in untransfected BMDMs upon LPS stimulation and quantification (n = 3). (o) Representative Western blot of ARG1 in control cells upon 72 h LPS stimulation with sodium oxamate and quantification (n = 3). (p) Representative Western blot of KLA upon 72 h LPS stimulation with sodium oxamate and quantification (n = 3). Western blot molecular weights KLA 15 kDa, PDH 43 kDa, ARG1 40 kDa, β-Actin 45 kDa and HSP90 90 kDa. Data are presented as the mean of biological replicates ± SEM. Statistical analysis a, c, f, o, p by unpaired Student’s t test and g, i, k, m, n by one-way ANOVA.

Similar articles

Cited by

References

    1. Moore KJ, Tabas I.. Macrophages in the pathogenesis of atherosclerosis. Cell. 2011;145:341–355. PMID: 21529710 doi:10.1016/j.cell.2011.04.005. - DOI - PMC - PubMed
    1. Rodríguez-Prados J-C, Través PG, Cuenca J, Rico D, Aragonés J, Martín-Sanz P, Cascante M, Boscá L.. Substrate fate in activated macrophages: a comparison between innate, classic, and alternative activation. J Immunol. 2010;185:605–614. PMID: 20498354 doi:10.4049/jimmunol.0901698. - DOI - PubMed
    1. Murray PJ. Macrophage polarization. Annu Rev Physiol. 2017;79:541–566. PMID: 27813830 doi:10.1146/annurev-physiol-022516-034339. - DOI - PubMed
    1. Tabas I, Bornfeldt KE.. Macrophage phenotype and function in different stages of atherosclerosis. Circ Res. 2016;118:653–667. PMID: 26892964 doi:10.1161/CIRCRESAHA.115.306256. - DOI - PMC - PubMed
    1. Libby P. Vascular biology of atherosclerosis: overview and state of the art. Am J Cardiol. 2003;91:3A–6A. doi:10.1016/S0002-9149(02)03143-0.PMID: 12645637 - DOI - PubMed

Publication types