

Characterisation and development of histopathological lesions in a guinea pig model of Mycobacterium tuberculosis infection
- PMID: 37808110
- PMCID: PMC10556493
- DOI: 10.3389/fvets.2023.1264200
Characterisation and development of histopathological lesions in a guinea pig model of Mycobacterium tuberculosis infection
Abstract
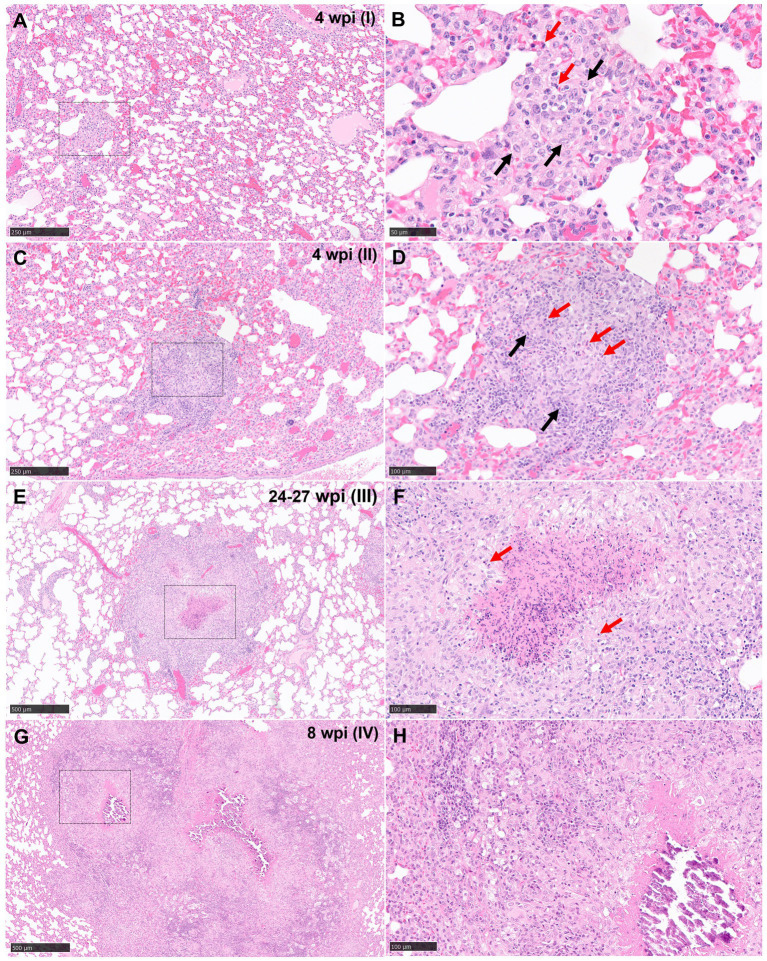
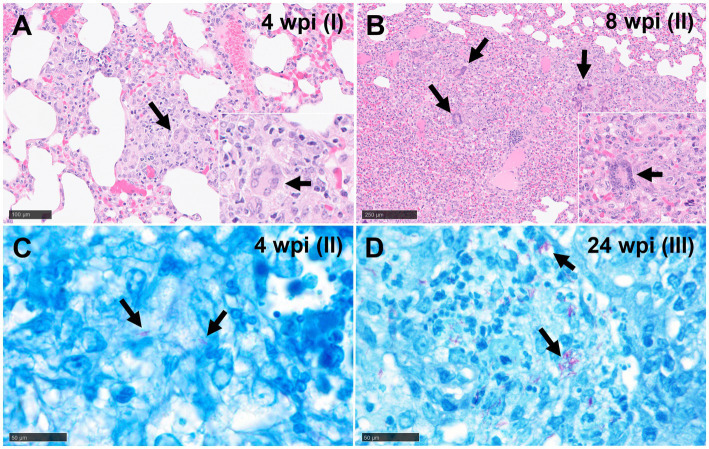
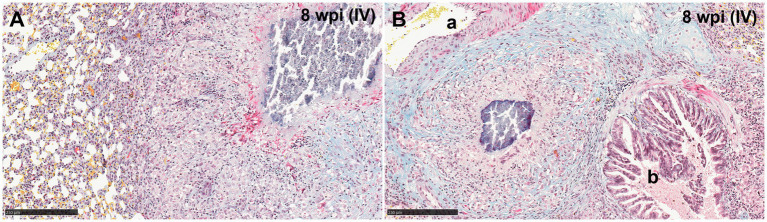
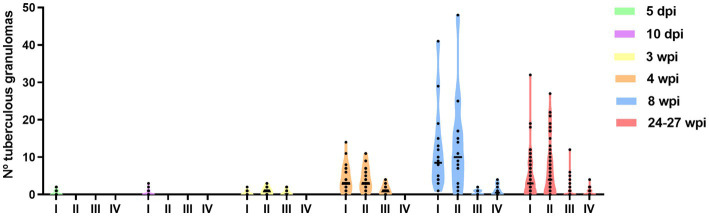
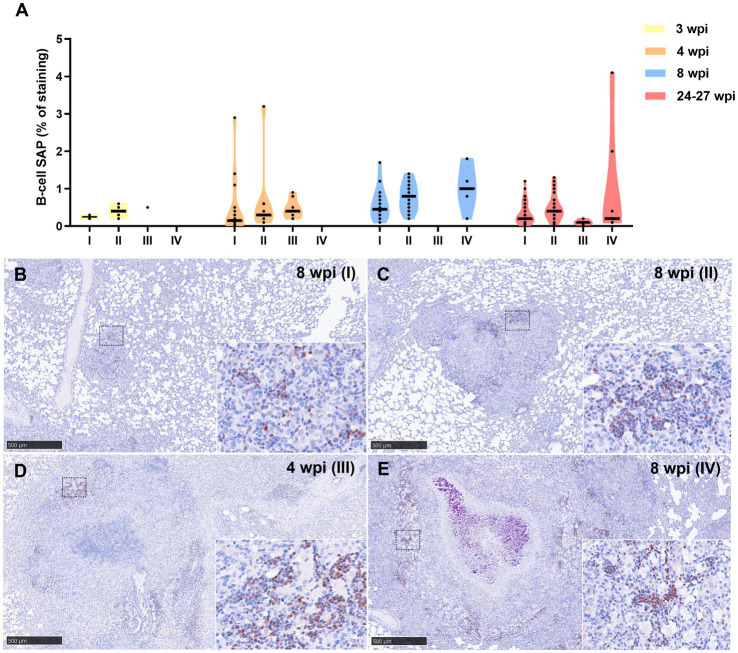
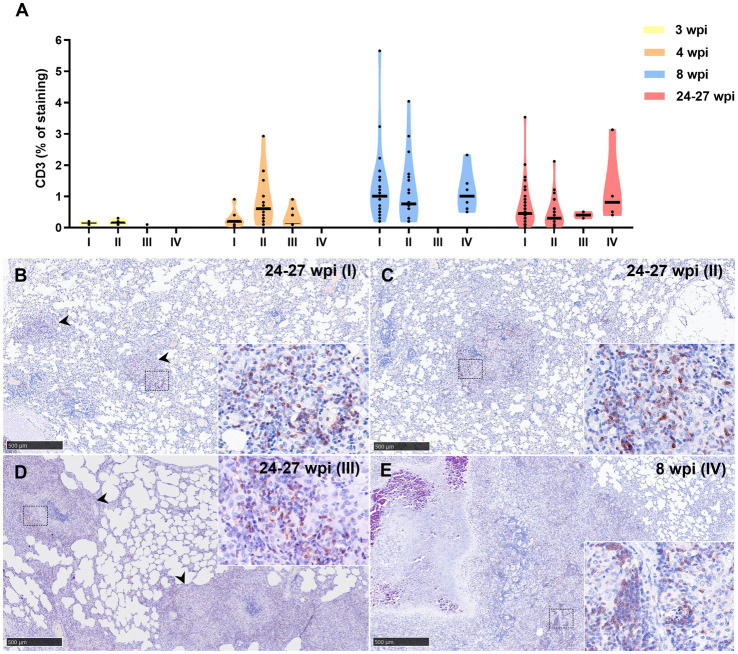
Tuberculosis (TB) remains a very significant infectious disease worldwide. New vaccines and therapies are needed, even more crucially with the increase of multi-drug resistant Mycobacterium tuberculosis strains. Preclinical animal models are very valuable for the development of these new disease control strategies. Guinea pigs are one of the best models of TB, sharing many features with the pathology observed in human TB. Here we describe the development of TB lesions in a guinea pig model of infection. We characterise the granulomatous lesions in four developmental stages (I-IV), using histopathological analysis and immunohistochemical (IHC) techniques to study macrophages, T cells, B cells and granulocytes. The granulomas in the guinea pigs start as aggregations of macrophages and few heterophils, evolving to larger lesions showing central caseous necrosis with mineralisation and abundant acid-fast bacilli, surrounded by a rim of macrophages and lymphocytes in the outer layers of the granuloma. Multinucleated giant cells are very rare and fibrotic capsules are not formed in this animal model.
Keywords: granuloma; guinea pig; immunohistochemistry, cell marker, Mycobacterium tuberculosis; pathology, animal model; tuberculosis.
Copyright © 2023 Larenas-Muñoz, Ruedas-Torres, Hunter, Bird, Agulló-Ros, Winsbury, Clark, Rayner and Salguero.
Conflict of interest statement
The authors declare that the research was conducted in the absence of any commercial or financial relationships that could be construed as a potential conflict of interest. The author(s) declared that they were an editorial board member of Frontiers, at the time of submission. This had no impact on the peer review process and the final decision.
Figures
Similar articles
-
Comparative pathology of experimental pulmonary tuberculosis in animal models.Front Vet Sci. 2023 Oct 12;10:1264833. doi: 10.3389/fvets.2023.1264833. eCollection 2023. Front Vet Sci. 2023. PMID: 37901102 Free PMC article. Review.
-
Spatial multiomic profiling reveals the novel polarization of foamy macrophages within necrotic granulomatous lesions developed in lungs of C3HeB/FeJ mice infected with Mycobacterium tuberculosis.Front Cell Infect Microbiol. 2022 Sep 27;12:968543. doi: 10.3389/fcimb.2022.968543. eCollection 2022. Front Cell Infect Microbiol. 2022. PMID: 36237431 Free PMC article.
-
Immunopathology of Pulmonary Mycobacterium tuberculosis Infection in a Humanized Mouse Model.Int J Mol Sci. 2024 Jan 29;25(3):1656. doi: 10.3390/ijms25031656. Int J Mol Sci. 2024. PMID: 38338937 Free PMC article.
-
Location of intra- and extracellular M. tuberculosis populations in lungs of mice and guinea pigs during disease progression and after drug treatment.PLoS One. 2011 Mar 21;6(3):e17550. doi: 10.1371/journal.pone.0017550. PLoS One. 2011. PMID: 21445321 Free PMC article.
-
Animal models of tuberculosis: Guinea pigs.Cold Spring Harb Perspect Med. 2014 Dec 18;5(5):a018572. doi: 10.1101/cshperspect.a018572. Cold Spring Harb Perspect Med. 2014. PMID: 25524720 Free PMC article. Review.
Cited by
-
Assessment of Innovative Dry Powders for Inhalation of a Synergistic Combination Against Mycobacterium tuberculosis in Infected Macrophages and Mice.Pharmaceutics. 2025 May 27;17(6):705. doi: 10.3390/pharmaceutics17060705. Pharmaceutics. 2025. PMID: 40574018 Free PMC article.
-
The efflux pumps Rv1877 and Rv0191 play differential roles in the protection of Mycobacterium tuberculosis against chemical stress.Front Microbiol. 2024 Mar 4;15:1359188. doi: 10.3389/fmicb.2024.1359188. eCollection 2024. Front Microbiol. 2024. PMID: 38516013 Free PMC article.
-
Understanding the development of tuberculous granulomas: insights into host protection and pathogenesis, a review in humans and animals.Front Immunol. 2024 Dec 9;15:1427559. doi: 10.3389/fimmu.2024.1427559. eCollection 2024. Front Immunol. 2024. PMID: 39717773 Free PMC article. Review.
-
Comparative pathology of experimental pulmonary tuberculosis in animal models.Front Vet Sci. 2023 Oct 12;10:1264833. doi: 10.3389/fvets.2023.1264833. eCollection 2023. Front Vet Sci. 2023. PMID: 37901102 Free PMC article. Review.
-
Microenvironments of tuberculous granuloma: advances and opportunities for therapy.Front Immunol. 2025 Mar 24;16:1575133. doi: 10.3389/fimmu.2025.1575133. eCollection 2025. Front Immunol. 2025. PMID: 40196129 Free PMC article. Review.
References
-
- WHO . Tuberculosis. World Health Organization; (2023). Available at: https://www.who.int/news-room/fact-sheets/detail/tuberculosis (Accessed June 29, 2023)
-
- WHO . Global Tuberculosis report 2022. (2022). Available at: http://apps.who.int/bookorders
Grants and funding
LinkOut - more resources
Full Text Sources