

Development and Validation of a Propionate Metabolism-Related Gene Signature for Prognostic Prediction of Hepatocellular Carcinoma
- PMID: 37808224
- PMCID: PMC10557974
- DOI: 10.2147/JHC.S420614
Development and Validation of a Propionate Metabolism-Related Gene Signature for Prognostic Prediction of Hepatocellular Carcinoma
Abstract
Background: Studies have demonstrated that propionate metabolism-related genes (PMRGs) are associated with cancer progression. PMRGs are not known to be involved in Hepatocellular carcinoma (HCC).
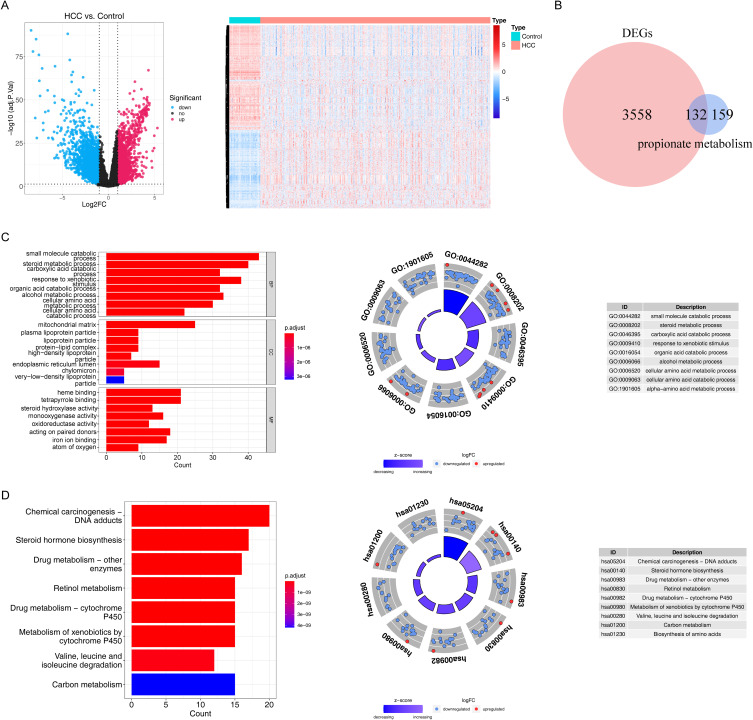
Methods: In this study, The Cancer Genome Atlas (TCGA) and Gene Expression Omnibus (GEO) databases were accessed for HCC-related transcriptome data and clinical information. First, DE-PMRGs were derived by intersecting PMRGs and DEGs between HCC tissues and normal controls. The clusterProfiler R package was then used to enrich DE-PMRGs. In addition, biomarkers of HCC were identified, and a prognostic model was developed. Using functional analysis and tumor microenvironment analysis, new insights were obtained into HCC. The expression of biomarkers was validated using quantitative real-time polymerase chain reaction (qRT-PCR).
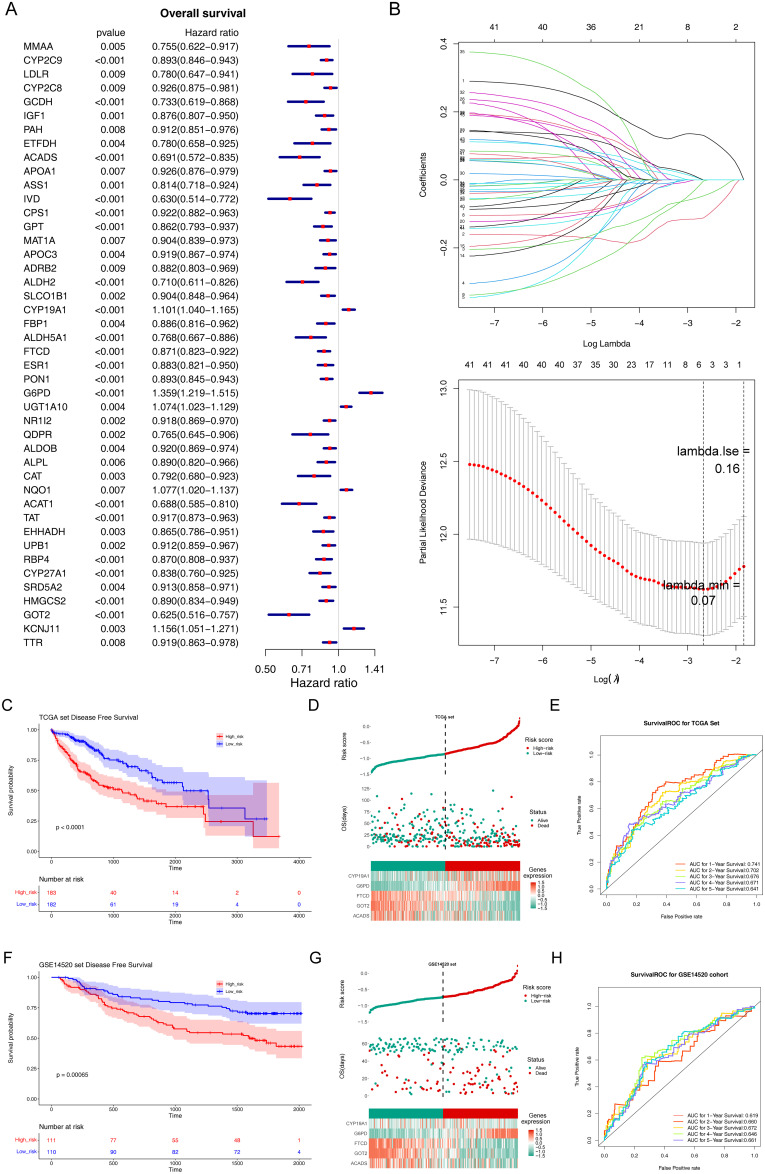
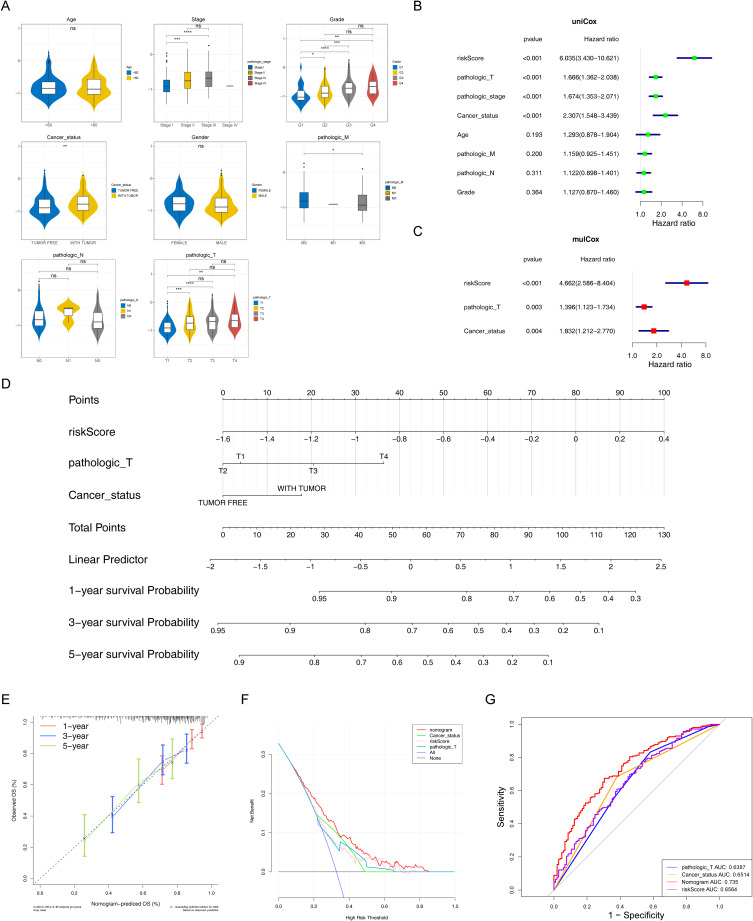
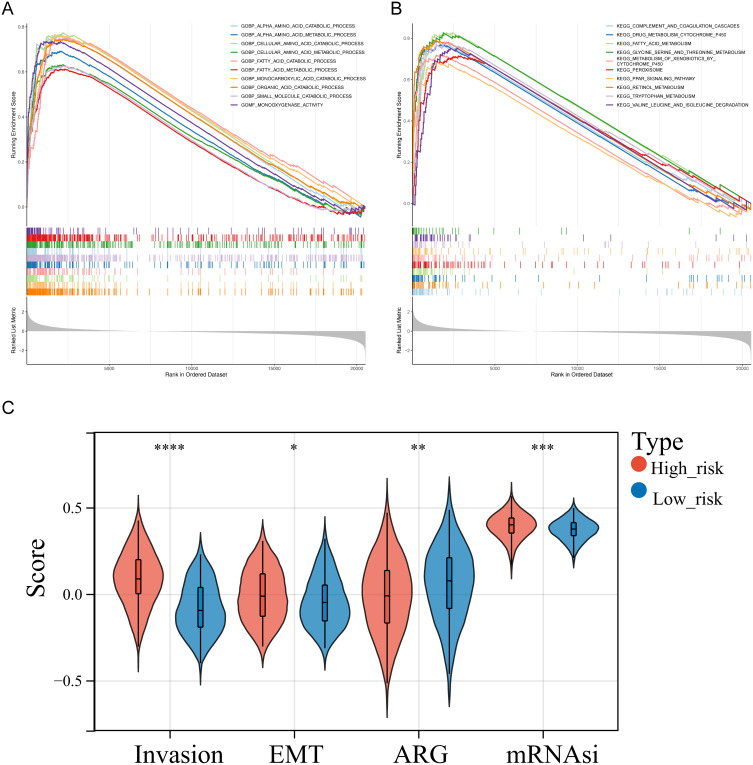
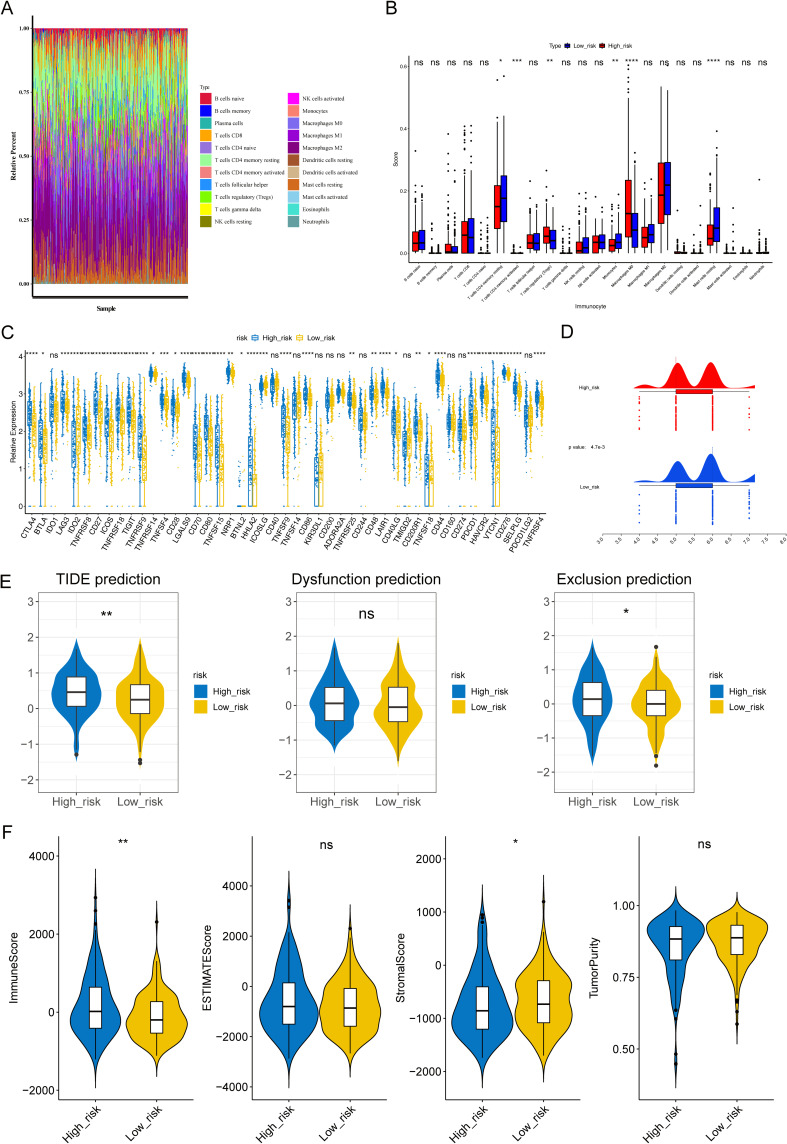
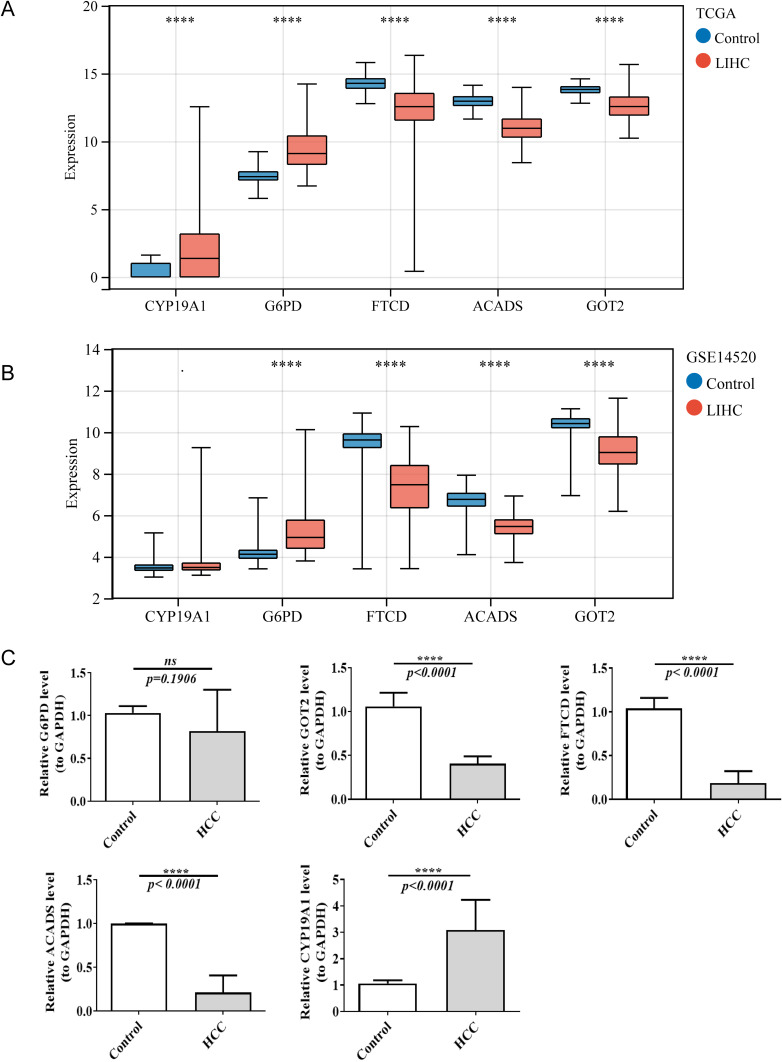
Results: 132 DE-PMRGs were obtained by intersecting 3690 DEGs and 291 PMRGs. Steroid and organic acid metabolism were associated with these genes. For the construction of the risk model for HCC samples, five biomarkers were identified, including Acyl-CoA dehydrogenase short chain (ACADS), CYP19A1, formiminotransferase cyclodeaminase (FTCD), glucose-6-phosphate dehydrogenase (G6PD), and glutamic-oxaloacetic transaminase (GOT2). ACADS, FTCD, and GOT2 were positive factors, whereas CYP19A1 and G6PD were negative. HCC patients with AUC greater than 0.6 were predicted to survive 1/2/3/4/5 years, indicating decent efficiency of the model. The probability of 1/3/5-survival for HCC was also predicted by the nomogram using the risk score, pathologic T stage, and cancer status. Moreover, functional enrichment analysis revealed the high-risk genes were associated with invasion and epithelial-mesenchymal transition. Significantly, immune cell infiltration and immune checkpoint expression were linked to HCC development.
Conclusion: This study identified five biomarkers of propionate metabolism that can predict HCC prognosis. This finding may provide a deeper understanding of PMRG function in HCC.
Keywords: Hepatocellular carcinoma; biomarkers; prognosis; propionate metabolism-related genes; tumor microenvironment.
© 2023 Xiao et al.
Conflict of interest statement
The authors of this manuscript declare no relationships with any companies whose products or services may be related to the article’s subject matter.
Figures
Similar articles
-
Development of a propionate metabolism-related gene-based molecular subtypes and scoring system for predicting prognosis in bladder cancer.Eur J Med Res. 2024 Jul 29;29(1):393. doi: 10.1186/s40001-024-01982-6. Eur J Med Res. 2024. PMID: 39075554 Free PMC article.
-
Revealing propionate metabolism-related genes in glioblastoma and investigating their underlying mechanisms.Front Oncol. 2025 Apr 17;15:1529369. doi: 10.3389/fonc.2025.1529369. eCollection 2025. Front Oncol. 2025. PMID: 40313243 Free PMC article.
-
Construction and validation of a novel signature based on epithelial-mesenchymal transition-related genes to predict prognosis and immunotherapy response in hepatocellular carcinoma by comprehensive analysis of the tumor microenvironment.Funct Integr Genomics. 2022 Dec 20;23(1):6. doi: 10.1007/s10142-022-00933-w. Funct Integr Genomics. 2022. PMID: 36536232 Free PMC article.
-
GOT2: New therapeutic target in pancreatic cancer.Genes Dis. 2024 Jul 2;12(4):101370. doi: 10.1016/j.gendis.2024.101370. eCollection 2025 Jul. Genes Dis. 2024. PMID: 40247913 Free PMC article. Review.
-
Spotlight on GOT2 in Cancer Metabolism.Onco Targets Ther. 2023 Aug 22;16:695-702. doi: 10.2147/OTT.S382161. eCollection 2023. Onco Targets Ther. 2023. PMID: 37635751 Free PMC article. Review.
Cited by
-
Development of a propionate metabolism-related gene-based molecular subtypes and scoring system for predicting prognosis in bladder cancer.Eur J Med Res. 2024 Jul 29;29(1):393. doi: 10.1186/s40001-024-01982-6. Eur J Med Res. 2024. PMID: 39075554 Free PMC article.
-
Glutathiones' life in multi-cancers: especially their potential micropetides in liver hepatocellular carcinoma.Discov Oncol. 2025 Feb 18;16(1):201. doi: 10.1007/s12672-025-01945-1. Discov Oncol. 2025. PMID: 39966283 Free PMC article.
-
Revealing propionate metabolism-related genes in glioblastoma and investigating their underlying mechanisms.Front Oncol. 2025 Apr 17;15:1529369. doi: 10.3389/fonc.2025.1529369. eCollection 2025. Front Oncol. 2025. PMID: 40313243 Free PMC article.
-
Probiotics Mixture, Prohep: a Potential Adjuvant for Low-Dose Sorafenib in Metabolic Dysfunction-Associated Steatotic Liver Disease-Associated Hepatocellular Carcinoma Suppression Through Modulating Gut Microbiota.Probiotics Antimicrob Proteins. 2025 May 23. doi: 10.1007/s12602-025-10593-4. Online ahead of print. Probiotics Antimicrob Proteins. 2025. PMID: 40405038
-
Dendritic Cell-Related Gene Signatures in Hepatocellular Carcinoma: An Analysis for Prognosis and Therapy Efficacy Evaluation.J Hepatocell Carcinoma. 2024 Sep 17;11:1743-1761. doi: 10.2147/JHC.S481338. eCollection 2024. J Hepatocell Carcinoma. 2024. PMID: 39309303 Free PMC article.
References
LinkOut - more resources
Full Text Sources
Miscellaneous
