. 2023 Oct 5;4(5):e392.
doi: 10.1002/mco2.392. eCollection 2023 Oct.

Tissue-type plasminogen activator (tPA) homozygous Tyr471His mutation associates with thromboembolic disease

Affiliations

Tissue-type plasminogen activator (tPA) homozygous Tyr471His mutation associates with thromboembolic disease

Yanyi Tao et al. MedComm (2020). .

Abstract

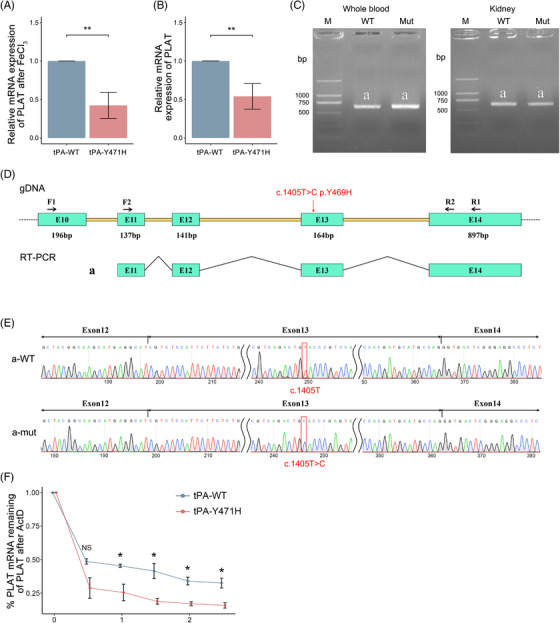
Tissue-type plasminogen activator (tPA) encoded by PLAT is a major mediator that promotes fibrinolysis and prevents thrombosis. Pathogenetic mutations in PLAT associated with venous thromboembolism have rarely been reported. Here, we report the first case of a homozygous point mutation c.1411T>C (p.Y471H) in PLAT leading to thromboembolic events and conduct related functional studies. The corresponding tPA mutant protein (tPA-Y471H) and wild-type tPA (tPA-WT) were synthesized in vitro, and mutant mice (PLATH/H mice) were constructed. The molecular docking and surface plasmon resonance results indicated that the mutation impeded the hydrogen-bonding interactions between the protease domain of tPA and the kringle 4 domain of plasminogen, and the binding affinity of tPA and plasminogen was significantly reduced with a difference of one order of magnitude. mRNA half-life assay showed that the half-life of tPA-Y471H was shortened. The inferior vena cava thrombosis model showed that the rate of venous thrombosis in PLATH/H mice was 80% compared with 53% in wild-type mice. Our data suggested a novel role for the protease domain of tPA in efficient plasminogen activation, and demonstrated that this tPA mutation could reduce the fibrinolysis function of the body and lead to an increased propensity for thrombosis.

Keywords: arterial thrombosis; mutation; protease domain; tissue‐type plasminogen activator; venous thromboembolism.


Conflict of interest statement

The authors declare they have no conflicts of interest.

Figures

FIGURE 1
FIGURE 1
Genetic analysis of the probands, surface plasmon resonance (SPR), and molecular docking analysis of tissue‐type plasminogen activator (tPA) binding to plasminogen and plasminogen activator inhibitor‐1 (PAI‐1). (A) Gene sequencing results showed that the proband had a homozygous mutation of T base to C base at site 1411 of gene PLAT. (B) His parents and daughter were heterozygous for c.1411T>C. (C and D) SPR analysis of wild‐type tissue plasminogen activator (tPA‐WT) and tissue plasminogen activator with a p.Tyr471His (tPA‐Y471H) binding with plasminogen. (E and F) SPR analysis of tPA‐WT and tPA‐Y471H binding with PAI‐1. (G) Models of tPA‐WT (left panel) and tPA‐Y471H (right panel) bound to plasminogen, respectively. (H) Models of tPA‐WT (left panel) and tPA‐Y471H (right panel) bound to PAI‐1. Blue indicates tPA, purple indicates plasminogen, yellow indicates PAI‐1, and green lines indicates hydrogen bonds. The interacting nucleotides are presented in Table 1.
FIGURE 2
FIGURE 2
Tissue‐type plasminogen activator (tPA)‐mediated conversion of plasminogen to plasmin and clot lysis assay. (A) Time course of conversion of plasminogen to plasmin in the presence of fibrin detected by SDS‐PAGE and immunoblotting using anti‐plasminogen antibody. (B) Densitometry analysis of bands in (A) representing remaining percentage of zymogen plasminogen in sample (n = 3). The means ± standard deviation (SD) (y‐axis) are shown over time (x‐axis). *, **, ***, and ns on time denote differences in tissue plasminogen activator with a p.Tyr471His (tPA‐Y471H) from wild‐type tissue plasminogen activator (tPA‐WT). * p < 0.05; ** p < 0.01; *** p < 0.001; ns: not significant as determined by unpaired t‐test. (C) Clot lysis time of each group was calculated. ** p < 0.01, unpaired t‐test. (D) Clot lysis curves monitored by turbidity measurement at 405 nm. Three independent experiments were performed in each group.
FIGURE 3
FIGURE 3
Mutation reduced the fibrinolytic function of tissue‐type plasminogen activator (tPA). (A) Clots were prepared with fibrinogen containing Alexa Fluor 594‐label and the fluid/fibrin interface was monitored by microscope using fluorescent tracing. Progression of the lysis front was observed after 0 min (a and c), 5 min (b and e), and 10 min (c and f). Scale bar, 100 μm. (B) The mean overall lysis rate was calculated. The graph bars represent mean ± standard deviation (SD) of three independent experiments. Unpaired t‐test was used for statistical analysis. * p < 0.05; ** p < 0.01; *** p < 0.001; ns: not significant. (C) Clot lysis assay by agar plate method. The panel was observed after 2, 12, and 24 h of incubation at 37°C. The three wells were wild‐type tissue plasminogen activator (tPA‐WT), tissue plasminogen activator with p.Tyr471His (tPA‐Y471H), and phosphate‐buffered saline (PBS). Scale bar, 5 mm. (D) Changes in diameter were observed and the mean lysis rate was calculated. The graph bars represent mean ± SD of three independent experiments, unpaired t‐test. * p < 0.05; ** p < 0.01; *** p < 0.001; ns: not significant.
FIGURE 4
FIGURE 4
Changes in systemic fibrinolytic activity in PLATH/H mice. (A) Plasma tissue‐type plasminogen activator (tPA) concentration by ELISA. (B) Plasma tPA activity by enzymatic assay. (C and D) Plasma plasminogen and plasminogen activator inhibitor‐1 (PAI‐1) concentrations by ELISA. (E and G) Plasma fibrinogen (FIB), D‐dimer (DDI), and fibrin degradation products (FDP) were measured by an automatic coagulator. Blue indicates wild‐type mouse group and red indicates PLATH/H mouse group. N = 8 mice per group. Bars represent the group mean ± standard deviation (SD). Between the two dashed lines are the reference ranges for measurements from healthy control. An unpaired t‐test was used for statistical analysis. * p < 0.05; ** p < 0.01; *** p < 0.001; ns: not significant.
FIGURE 5
FIGURE 5
Mutation increases the propensity for thrombosis in PLATH/H mice. (A) Venous thrombus formation differed between PLATH/H male mice and wild‐type male mice. N = 15 mice per group. (B and C) Comparison of average thrombus weight and length between the two groups. Data are presented as median and interquartile range (IQR) where appropriate. An unpaired t‐test was used for statistical analysis. * p < 0.05; ** p < 0.01; *** p < 0.001; ns: not significant. (D) Changes in D‐dimer concentration in plasma of mice before inferior vena cava (IVC) stenosis and 12, 24, and 48 h after IVC stenosis. N = 5 male mice per group. (E and G) Time to occlusive carotid arterial thrombosis induced by 10% FeCl3 injury. N = 10 mice per group. Data are presented as median and IQR where appropriate. (H and I) Plasma tissue‐type plasminogen activator (tPA) concentration 1 week before (basal) and 20 min after FeCl3‐induced carotid artery thrombosis; tPA release was calculated by subtracting the basal value from the after‐FeCl3 value for each mouse. N = 10 mice per group. Data are presented as median and IQR where appropriate.
FIGURE 6
FIGURE 6
The mutant tissue‐type plasminogen activator (tPA) had a shorter half‐life. (A) PLAT mRNA in carotid arterial lysates normalized to 18S and expressed as relative to the value in wild‐type mice. Mice were randomly selected from 20 min after FeCl3‐induced injury. N = 5 mice per group. Bars represent the group mean ± standard deviation (SD). (B) As described above, the mice were not given any intervention. N = 5 mice per group. Bars represent the group mean ± SD. An unpaired t‐test was used for statistical analysis. * p < 0.05; ** p < 0.01; *** p < 0.001; ns: not significant. (C) Agarose gel electrophoresis for the polymerase chain reaction (PCR) products in peripheral blood and kidney (b and a). The results all showed a single band, and the band size was 626 bp as expected. (D) Schematic diagram of primer design and splicing model. The splicing mode of band a is exon 12 (141 bp)–exon 13 (164 bp)–exon 14 (897 bp). The red arrow indicates the location of the mutation. The letter E stands for exon, letter F stands for forward primer, and R stands for reverse primer. (E) Sanger sequencing results of band a in (C). (F) The results of PLAT mRNA remaining percentage analysis in sample. N = 5 mice per group. The means ± SD (y‐axis) are shown over time (x‐axis). * and ns on time denote differences in tissue plasminogen activator with a p.Tyr471His (tPA‐Y471H) from wild‐type tissue plasminogen activator (tPA‐WT).

References

    1. Collen D, Lijnen HR. Basic and clinical aspects of fibrinolysis and thrombolysis. Blood. 1991;78:3114‐3124. - PubMed
    1. Henderson SJ, Weitz JI, Kim PY. Fibrinolysis: strategies to enhance the treatment of acute ischemic stroke. J Thromb Haemost. 2018;16:1932‐1940. - PubMed
    1. Prabhakaran S, Ruff I, Bernstein RA. Acute stroke intervention: a systematic review. JAMA. 2015;313:1451‐1462. - PubMed
    1. Ismail AA, Shaker BT, Bajou K. The plasminogen‐activator plasmin system in physiological and pathophysiological angiogenesis. Int J Mol Sci. 2021;23:337. - PMC - PubMed
    1. Verstraete M. Newer thrombolytic agents. Ann Acad Med Singap. 1999;28:424‐433. - PubMed