. 2023 Sep 21:14:1254728.
doi: 10.3389/fmicb.2023.1254728. eCollection 2023.

Hepatitis C virus alters the morphology and function of peroxisomes

Affiliations

Hepatitis C virus alters the morphology and function of peroxisomes

Esther Martin de Fourchambault et al. Front Microbiol. .

Abstract

Despite the introduction of effective treatments for hepatitis C in clinics, issues remain regarding the liver disease induced by chronic hepatitis C virus (HCV) infection. HCV is known to disturb the metabolism of infected cells, especially lipid metabolism and redox balance, but the mechanisms leading to HCV-induced pathogenesis are still poorly understood. In an APEX2-based proximity biotinylation screen, we identified ACBD5, a peroxisome membrane protein, as located in the vicinity of HCV replication complexes. Confocal microscopy confirmed the relocation of peroxisomes near HCV replication complexes and indicated that their morphology and number are altered in approximately 30% of infected Huh-7 cells. Peroxisomes are small versatile organelles involved among other functions in lipid metabolism and ROS regulation. To determine their importance in the HCV life cycle, we generated Huh-7 cells devoid of peroxisomes by inactivating the PEX5 and PEX3 genes using CRISPR/Cas9 and found that the absence of peroxisomes had no impact on replication kinetics or infectious titers of HCV strains JFH1 and DBN3a. The impact of HCV on peroxisomal functions was assessed using sub-genomic replicons. An increase of ROS was measured in peroxisomes of replicon-containing cells, correlated with a significant decrease of catalase activity with the DBN3a strain. In contrast, HCV replication had little to no impact on cytoplasmic and mitochondrial ROS, suggesting that the redox balance of peroxisomes is specifically impaired in cells replicating HCV. Our study provides evidence that peroxisome function and morphology are altered in HCV-infected cells.

Keywords: APEX2; CRISPR-Cas9; HCV genotype; ROS; hepatitis C virus; peroxisome; proximity biotinylation.


Conflict of interest statement

The authors declare that the research was conducted in the absence of any commercial or financial relationships that could be construed as a potential conflict of interest.

Figures

Figure 1
Figure 1
(A,B) Immunofluorescence microscopy of biotinylated cells expressing the SGR-APEX (A) or non-tagged SGR (B) double labeled with A488-streptavidin (green) and with anti-NS5A antibody (red). Nuclei were stained with DAPI (blue). Bars, 20 μm. (C) Immunoblot analysis of biotinylated proteins. HCV SGR-APEX-containing and control Huh-7 cells pre-incubated in the presence of BP were treated in the presence (+) or in the absence (−) of H2O2 for 1 min, quenched and lysed. Cell lysates were probed with streptavidin-HRP (left side of the blot) or with an anti-NS5A antibody (right side of the blot). (D) Immunoblot analysis of proteins purified with strepatividin beads. HCV SGR-APEX-containing and control Huh-7 cells were processed as described in (C). Biotinylated proteins were purified using strepatvidin beads and analyzed by immunoblot with streptavidin-HRP (left side of the blot) and with an antibody to HCV NS3 (right side of the blot). Note that mammalian cells have four endogenously biotinylated proteins that are detected in control conditions.
Figure 2
Figure 2
(A) APEX2-mediated biotinylation of ACBD5. Huh-7 cells containing APEX2- or GFP-tagged HCV replicons (SGR) were pre-incubated in the presence (+) or the absence (−) of BP, treated with H2O2 for 1 min, quenched and lysed in RIPA buffer. Biotinylated proteins were purified using strepatvidin beads and analyzed by immunoblot, together with 8% of the inputs (lysates), with antibodies to ACBD5, HCV NS3 and tubulin. (B–E) Intracellular localization of GFP-ACBD5 transfected in naïve Huh-7 cells (B) or in HCV SGR-containing Huh-7 cells (C,D). As a control, GFP was expressed in SGR-containing cells (E). Transfected cells were fixed and processed for immunofluorescence staining of HCV NS5A (left panels, red in merge panels) and PEX14 (third panels from the left, blue in merge panels), and imaged with a confocal microscope. GFP-ACBD5 and GFP (second panels from the left, green in merge panels) were detected using GFP fluorescence and nuclei were stained with DAPI (grey in merge panels). Yellow arrowheads indicate examples of regions where markers are co-distributed. Bar, 10 μm.
Figure 3
Figure 3
(A–C) Intracellular localization of endogenous PEX14 in naïve (A) or HCV SGR-containing Huh-7 cells (B,C). Cells were fixed and processed for immunofluorescence staining of HCV NS5A (left panels, green in merge panels) and PEX14 (middle panels, red in merge panels), and imaged with a high-resolution (Airyscan) confocal microscope. Nuclei were stained with DAPI (blue in merge panels). Bars, 10 μm. (D) Analysis of ACBD5 colocalization with HCV NS3 and NS5A. HCV SGR-containing Huh-7 cells were double labeled with antibodies to ACBD5 and NS3 or NS5A, and the Pearson correlation coefficient (PCC) was calculated on at least 30 individual cells imaged with a confocal microscope. (E) Fluorescence intensity plot along the double arrowed line indicated in B, merge panel.
Figure 4
Figure 4
Alteration of peroxisome morphology in HCV-infected and replicon-containing Huh-7 cells. (A–C) Immunofluorescence analysis of NS5A (green) and PEX14 (red) at 7 days after infection with JFH1 (A) or DBN3a (B) strains, or in naïve Huh-7 cells (C). (D) Number of cells with altered (larger and/or tubule-like) peroxisomes in HCV infected cells at different time points post infection and in Huh-7 cells permanently expressing a JFH1 or DBN3a SGR. (E) Mean volume of peroxisomes. (F) Mean number of peroxisomes per cell. Bars represent the mean +/− SD of 30 cells from 3 different infections. *, p < 0.05; **, p < 0.01; ***, p < 0.001; ****, p < 0.0001 (Kruskall-Wallis test).
Figure 5
Figure 5
Differential expression analysis of proteins in JFH1 (A) and DBN3a (B) SGR-containing cells. Proteins of total cell lysates were analyzed by LC–MS/MS (4 replicates per sample). Peroxisome proteins are displayed in black and other identified proteins either in pink (those with a significant difference of expression) or in grey (non differentially expressed). (C) Multivariate analysis of peroxisomal proteins expression using PLS-DA (Partial Least-Squares Discriminant Analysis). Groups to be discriminated were control Huh-7 cells (Hu) and DBN3a and JFH1 SGR-containing cells.
Figure 6
Figure 6
HCV infection in PEX5-KO Huh-7 cells. (A) Immunoblot analysis of Pex5 protein expression in control and PEX5-KO cells. (B) Immunofluorescence pattern of catalase in control and PEX5-KO cells. (C) Quantification of the number of PEX5-KO cells in the 3 populations using the catalase pattern assay. (D,E) Huh-7 cells were electroporated with JFH1 SGR (D) or a DBN3a SGR (E) expressing Renilla luciferase or with a non-replicative SGR (GND). Samples were harvested for luciferase assay at 4, 24, 48, 72, and 96 h post electroporation. The luciferase activity at 4 h post electroporation is expressed as 1. Error bars indicate standard errors of the means for 3 independent experiments performed in quadruplicate samples. (F) Huh-7, CD81-deficient Huh-7w7 and PEX5-KO cells were infected with JFH1 and cultured for 3 days. Supernatants were collected, filtered and infectious titers were determined. (G) Huh-7, CD81-deficient Huh-7w7 and PEX5-KO cells were infected with DBN3a and passed at 3, 6, and 15 dpi. At each passage, 1.5×10⁵ cells were seeded in a well of a P-24 plate. Twenty-four hours later, supernatants were collected and infectious titers were determined. *, p < 0.05; **, p < 0.01 (Mann–Whitney test).
Figure 7
Figure 7
HCV infection in PEX3-KO Huh-7 cells. (A) Immunoblot analysis of Pex3 protein, Pmp-70, catalase and tubulin expression in control and selected clones of PEX3-KO cells. (B,C) Huh-7 cells were electroporated with JFH1 SGR (B) or a DBN3a SGR (C) expressing Renilla luciferase or with a non-replicative SGR (GND). Samples were harvested for luciferase assay at 4, 24, 48, 72, and 96 h post electroporation. The luciferase activity at 4 h post electroporation is expressed as 1. Error bars indicate standard errors of the means for 3 independent experiments performed in quadruplicate samples. (D) Huh-7, CD81-deficient Huh-7w7 and PEX3-KO cells were infected with JFH1 and cultured for 3 days. Supernatants were collected, filtered and infectious titers were determined. (E) Huh-7, CD81-deficient Huh-7w7 and PEX3-KO cells were infected with DBN3a and passed at 3, 6 and 15 dpi. At each passage, 1.5×10⁵ cells were seeded in a well of a P-24 plate. Twenty-four hours later, supernatants were collected and infectious titers were determined. *, p < 0.05; **, p < 0.01 (Mann–Whitney test).
Figure 8
Figure 8
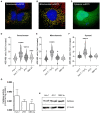
Alteration of ROS metabolism in HCV SGR-containing cells. (A) Immunofluorescence of peroxisomal roGFP2 sensor (green) transfected in Huh-7 cells co-stained with PEX14 (red). (B) Immunofluorescence of mitochondrial roGFP2 sensor (green) transfected in Huh-7 cells co-stained with TOM20 (red). (C) Immunofluorescence of cytosolic roGFP2 sensor (green) transfected in Huh-7 cells. (D–F) In situ measurements of the oxidation state of roGFP2 sensors in control and HCV SGR-containing Huh-7 cells transiently transfected with a peroxisomal (D), a mitochondrial (E) or a cytosolic (F) roGFP2-based sensor. Fluorescence images of live cells were acquired and the ratio of fluorescence emitted from 405- and 488-nm excitation were used to calculate the 405/488-nm excitation ratio. At least 90 cells from 3 independent transfections were used for each sample. Ratio values are presented as violin plots with the median and quartiles indicated as solid and dotted lines, respectively. (G) Catalase activity in cell lysates of control and SGR-containing Huh-7 cells. (H) Immunoblot analysis of catalase and tubulin expression in control and HCV SGR-containing Huh-7 cells. *, p < 0.05; **, p < 0.01; ***, p < 0.001; ****, p < 0.0001 (Kruskall-Wallis test).

References

    1. Ali R. O., Quinn G. M., Umarova R., Haddad J. A., Zhang G. Y., Townsend E. C., et al. (2023). Longitudinal multi-omics analyses of the gut-liver axis reveals metabolic dysregulation in hepatitis C infection and cirrhosis. Nat. Microbiol. 8, 12–27. doi: 10.1038/s41564-022-01273-y, PMID: - DOI - PubMed
    1. Arciello M., Gori M., Balsano C. (2013). Mitochondrial dysfunctions and altered metals homeostasis: new weapons to counteract HCV-related oxidative stress. Oxidative Med. Cell. Longev. 2013:971024. doi: 10.1155/2013/971024, PMID: - DOI - PMC - PubMed
    1. Baes M., Gressens P., Baumgart E., Carmeliet P., Casteels M., Fransen M., et al. (1997). A mouse model for Zellweger syndrome. Nat. Genet. 17, 49–57. doi: 10.1038/ng0997-49 - DOI - PubMed
    1. Bender S., Reuter A., Eberle F., Einhorn E., Binder M., Bartenschlager R. (2015). Activation of type I and III interferon response by mitochondrial and Peroxisomal MAVS and inhibition by hepatitis C virus. PLoS Pathog. 11:e1005264. doi: 10.1371/journal.ppat.1005264, PMID: - DOI - PMC - PubMed
    1. Benjamini Y., Hochberg Y. (1995). Controlling the false discovery rate: a practical and powerful approach to multiple testing. J. R. Stat. Soc. Ser. B 57, 289–300. doi: 10.1111/j.2517-6161.1995.tb02031.x - DOI