. 2023;16(10):871-876.
doi: 10.1038/s41561-023-01262-8. Epub 2023 Sep 7.

Melting of glacier ice enhanced by bursting air bubbles

Affiliations

Melting of glacier ice enhanced by bursting air bubbles

Meagan E Wengrove et al. Nat Geosci. 2023.

Abstract

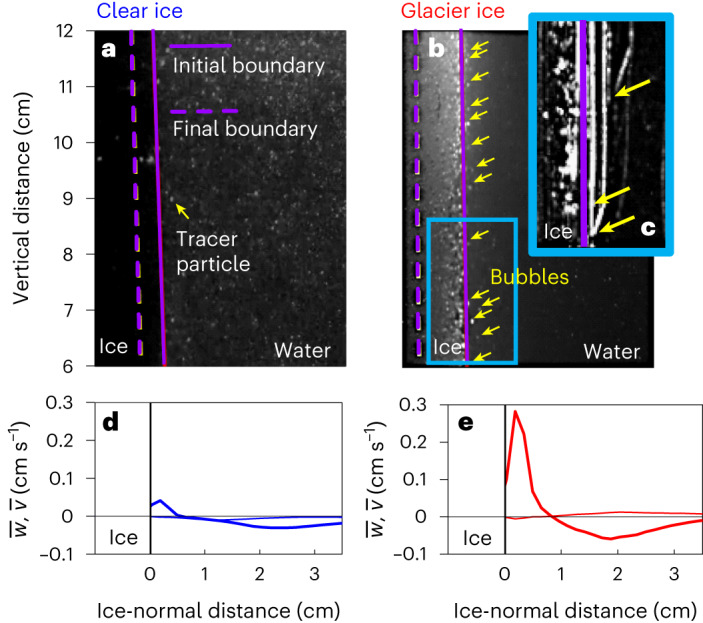
Feedbacks between ice melt, glacier flow and ocean circulation can rapidly accelerate ice loss at tidewater glaciers and alter projections of sea-level rise. At the core of these projections is a model for ice melt that neglects the fact that glacier ice contains pressurized bubbles of air due to its formation from compressed snow. Current model estimates can underpredict glacier melt at termini outside the region influenced by the subglacial discharge plume by a factor of 10-100 compared with observations. Here we use laboratory-scale experiments and theoretical arguments to show that the bursting of pressurized bubbles from glacier ice could be a source of this discrepancy. These bubbles eject air into the seawater, delivering additional buoyancy and impulses of turbulent kinetic energy to the boundary layer, accelerating ice melt. We show that real glacier ice melts 2.25 times faster than clear bubble-free ice when driven by natural convection in a laboratory setting. We extend these results to the geophysical scale to show how bubble dynamics contribute to ice melt from tidewater glaciers. Consequently, these results could increase the accuracy of modelled predictions of ice loss to better constrain sea-level rise projections globally.

Keywords: Cryospheric science; Physical oceanography.


Conflict of interest statement

Competing interestsThe authors declare no competing interests.

Figures

Fig. 1
Fig. 1. The influence of freshwater melt and bubble ejection on melt-plume signature for clear- (bubble-free) and glacier-ice melt.
a, Clear-ice ambient melt plume. b, Glacier-ice ambient melt plume enhanced by the air injected into and rising with the boundary layer. c, Photograph of a 2-mm-thick thin-section slice of the Greenland glacier ice we used in these experiments. The image is 2 cm wide, the scale bar tick marks are 1 mm. Ice was collected as part of a study of past atmospheric gases,.
Fig. 2
Fig. 2. Laboratory observations of melt and hydrodynamics adjacent to clear (bubble-free) and glacier ice during melt.
a,b, Instantaneous hydrodynamic conditions for clear bubble-free ice (a) and glacier ice (b). Geometry similar to Fig. 1. The solid purple vertical lines show the initial position of the ice face, the purple vertical dashed lines show the final position of the ice face after 1 hour. The clear bubble-free ice in a is optically non-reflective because it is completely clear and the small dots in the adjacent water are illuminated tracer particles. The glacier ice in b is very reflective because of the bubbles present in the ice as well as in the water. The yellow arrows highlight bubbles that have burst out of the ice and are rising to the tank surface. c, A 2-second time-averaged image of the glacier ice case showing the path lines of the bubbles ejecting and moving up the face of the ice as white streaks. The yellow arrows show three instances of actual bubble burst and rise events happening during this 2-second period. d,e, The measured ice-normal velocity profiles of w¯ (vertical velocity component, thick) and v¯ (ice-normal velocity component, thin) for the clear (blue, d) and glacier (red, e) ice, respectively. Source data
Fig. 3
Fig. 3. Laboratory observations of the mean KE and tke adjacent to clear (bubble-free) and glacier ice during melt.
a,b, Vertically averaged KE and tke for clear ice (blue; a) and glacier ice (red; b). c,d, Total energy balance for clear ice (blue; c) and glacier ice (red; d) showing the energy transport (thin line), dissipation (thick line) and the production due to meltwater and bubble plume rise (dashed line). The thick dashed line is the production term calculated from the plume vertical rise velocity and reduced gravity of the ambient melt plume. The shading around the energy transport and dissipation terms shows the associated standard deviation in measurement of those terms. Source data
Fig. 4
Fig. 4. Semi-empirical model results and accompanying schematics showing the influence of bubble ejection on glacier dynamics at field scale.
a, Buoyant density anomaly associated with freshwater melt (ρfresh, blue dashed line) and entrapped air in the glacier ice (ρair, red solid line). b, Predicted energy contributions from bubble buoyancy (Ebbubble, red dotted line) and explosive bursts (Etkeejection, red dashed line). c,d, Schematics consistent with two recent studies of observed terminus shape, overcut (c) or undercut (d). In c, multibeam acoustic imaging finds that some glaciers have overcut sections with melt that increases towards the surface (for example, Xeitl Sít’). We hypothesize that bubble ejection, along with circulation and internal waves could contribute to the overcut geometry, especially outside of the region of influence by the subglacial discharge plume. In d, plume-melt theory is used to determine glacier melt and predicts undercut glacier termini, generally biased by the subglacial discharge plume outflow (for example, ref. ). Source data

References

    1. Edwards TL, et al. Projected land ice contributions to twenty-first-century sea level rise. Nature. 2021;593:74–82. - PubMed
    1. Oppenheimer, M. et al. Sea level rise and implications for low-lying islands, coasts and communities. In IPCC Special Report on the Ocean and Cryosphere in a Changing Climate (eds Pörtner, H.-O., Roberts et al.) (Cambridge Univ. Press, 2019).
    1. Catania G, Stearns L, Moon T, Enderlin E, Jackson R. Future evolution of Greenland’s marine-terminating outlet glaciers. J. Geophys. Res. Earth Surf. 2020;125:2018–004873.
    1. Aschwanden A, Brinkerhoff D. Calibrated mass loss predictions for the Greenland Ice Sheet. Geophys. Res. Lett. 2022;49:e2022GL–099058.
    1. Straneo F, et al. The case for a sustained Greenland Ice Sheet-Ocean Observing System (GRIOOS) Front. Mar. Sci. 2019;6:138.

LinkOut - more resources