

Hot-spots detection in count data by Poisson assisted smooth sparse tensor decomposition
- PMID: 37808612
- PMCID: PMC10557627
- DOI: 10.1080/02664763.2022.2112557
Hot-spots detection in count data by Poisson assisted smooth sparse tensor decomposition
Abstract
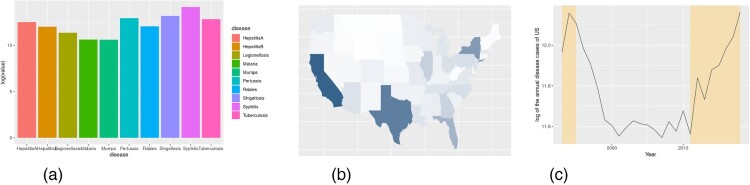
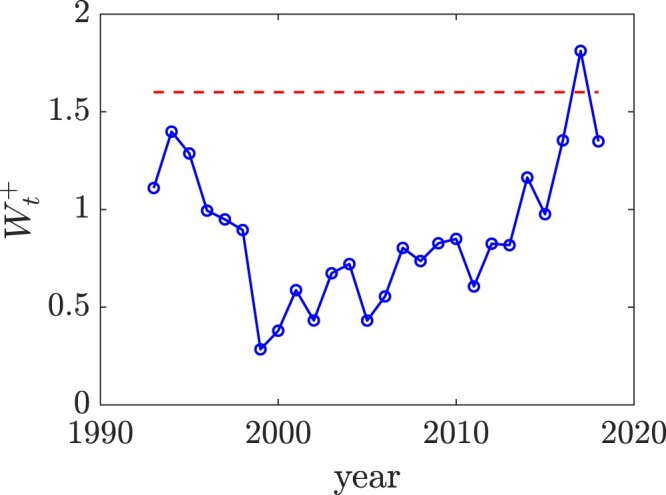
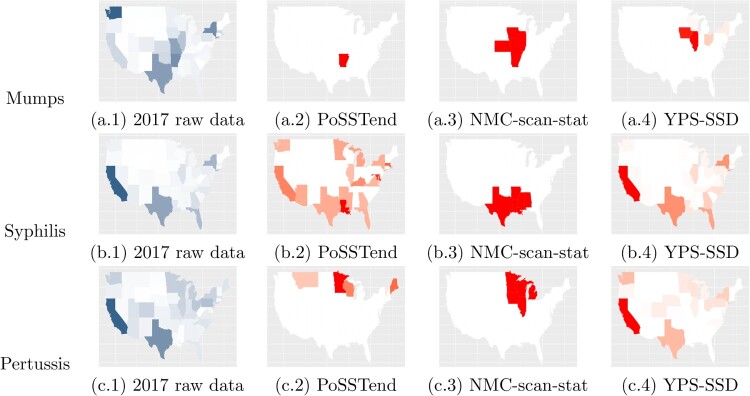
Count data occur widely in many bio-surveillance and healthcare applications, e.g. the numbers of new patients of different types of infectious diseases from different cities/counties/states repeatedly over time, say, daily/weekly/monthly. For this type of count data, one important task is the quick detection and localization of hot-spots in terms of unusual infectious rates so that we can respond appropriately. In this paper, we develop a method called Poisson assisted Smooth Sparse Tensor Decomposition (PoSSTenD), which not only detect when hot-spots occur but also localize where hot-spots occur. The main idea of our proposed PoSSTenD method is articulated as follows. First, we represent the observed count data as a three-dimensional tensor including (1) a spatial dimension for location patterns, e.g. different cities/countries/states; (2) a temporal domain for time patterns, e.g. daily/weekly/monthly; (3) a categorical dimension for different types of data sources, e.g. different types of diseases. Second, we fit this tensor into a Poisson regression model, and then we further decompose the infectious rate into two components: smooth global trend and local hot-spots. Third, we detect when hot-spots occur by building a cumulative sum (CUSUM) control chart and localize where hot-spots occur by their LASSO-type sparse estimation. The usefulness of our proposed methodology is validated through numerical simulation studies and a real-world dataset, which records the annual number of 10 different infectious diseases from 1993 to 2018 for 49 mainland states in the United States.
Keywords: CUSUM; Hot-spots detection; Poisson regression; spatio-temporal model; tensor decomposition.
© 2022 Informa UK Limited, trading as Taylor & Francis Group.
Conflict of interest statement
No potential conflict of interest was reported by the author(s).
Figures

References
-
- Beck A. and Teboulle M., A fast iterative shrinkage-thresholding algorithm for linear inverse problems, SIAM. J. Imaging. Sci. 2 (2009), pp. 183–202.
-
- Brègman L.M., Relaxation method for finding a common point of convex sets and its application to optimization problems, Doklady Akademii Nauk. 171 (1966), pp. 1019–1022. Russian Academy of Sciences.
-
- Chen J. and Fang F., Semiparametric likelihood for estimating equations with non-ignorable non-response by non-response instrument, J. Nonparametr. Stat. 31 (2019), pp. 420–434.
-
- Chen J., Fang F., and Xiao Z., Semiparametric inference for estimating equations with nonignorably missing covariates, J. Nonparametr. Stat. 30 (2018a), pp. 796–812.
-
- Chen J., Shao J., and Fang F., Instrument search in pseudo-likelihood approach for nonignorable nonresponse, Ann. Inst. Stat. Math. 73 (2021a), pp. 519–533.
Grants and funding
LinkOut - more resources
Full Text Sources