

Active learning-based multistage sequential decision-making model with application on common bile duct stone evaluation
- PMID: 37808618
- PMCID: PMC10557550
- DOI: 10.1080/02664763.2023.2164885
Active learning-based multistage sequential decision-making model with application on common bile duct stone evaluation
Abstract
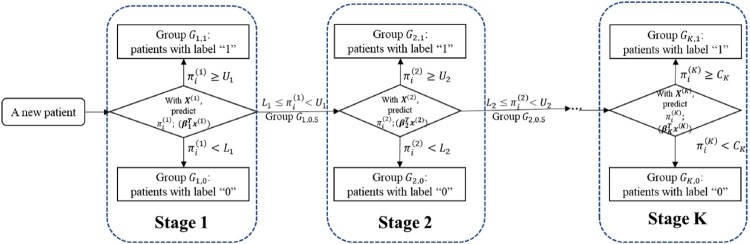
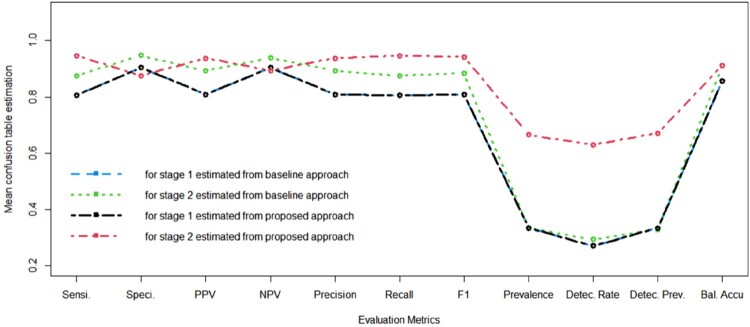
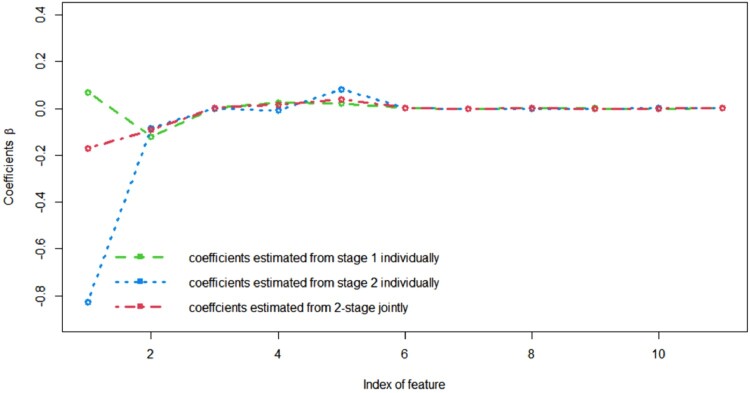
Multistage sequential decision-making occurs in many real-world applications such as healthcare diagnosis and treatment. One concrete example is when the doctors need to decide to collect which kind of information from subjects so as to make the good medical decision cost-effectively. In this paper, an active learning-based method is developed to model the doctors' decision-making process that actively collects necessary information from each subject in a sequential manner. The effectiveness of the proposed model, especially its two-stage version, is validated on both simulation studies and a case study of common bile duct stone evaluation for pediatric patients.
Keywords: Active learning; incomplete data; ordinal logistic model; sequential decision.
© 2023 Informa UK Limited, trading as Taylor & Francis Group.
Conflict of interest statement
No potential conflict of interest was reported by the author(s).
Figures
References
-
- Agresti A., Categorical Data Analysis, John Wiley & Sons, 2003.
-
- Agresti A. and Tarantola C., Simple ways to interpret effects in modeling ordinal categorical data, Stat. Neerl. 72 (2018), pp. 210–223.
-
- Avriel M., Nonlinear Programming: Analysis and Methods, Courier Corporation, 2003.
-
- Broyden C.G., Dennis Jr J.E., and Moré J.J, On the local and superlinear convergence of quasi-Newton methods, IMA J Appl. Math. 12 (1973), pp. 223–245.
-
- Búrkner P.C., Advanced Bayesian multilevel modeling with the R package brms, arXiv preprint (2017). Available at: arXiv:1705.11123.
LinkOut - more resources
Full Text Sources