

Detection and estimation of multiple transient changes
- PMID: 37808619
- PMCID: PMC10557625
- DOI: 10.1080/02664763.2023.2174257
Detection and estimation of multiple transient changes
Abstract
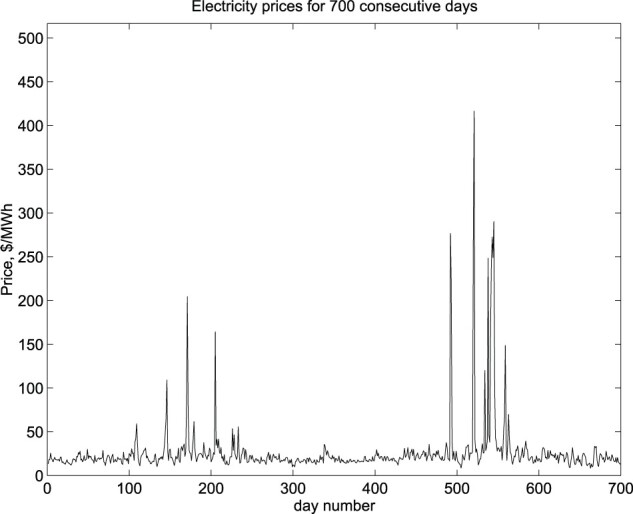
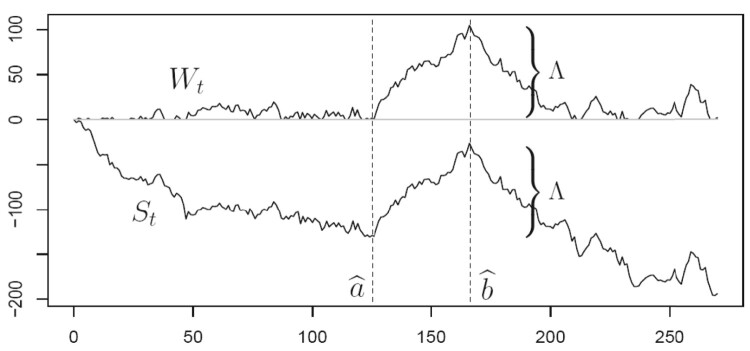
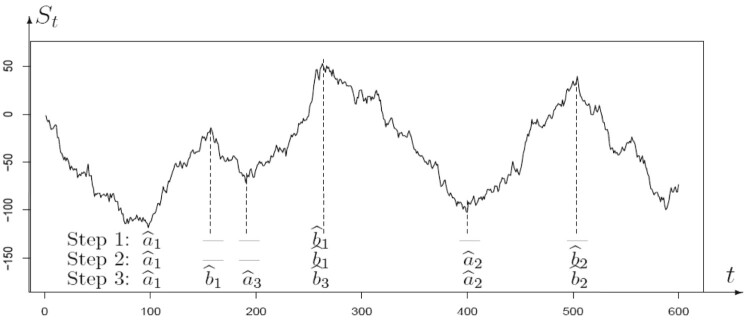
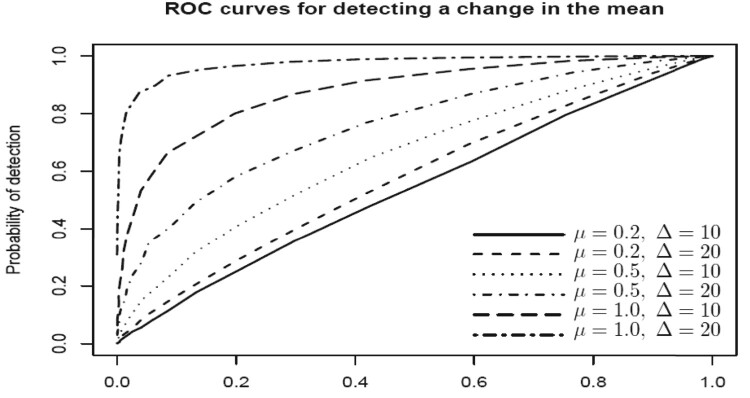
Change-point detection methods are proposed for the case of temporary failures, or transient changes, when an unexpected disorder is ultimately followed by a re-adjustment and return to the initial state. A base distribution of the 'in-control' state changes to an 'out-of-control' distribution for unknown periods of time. Likelihood based sequential and retrospective tools are proposed for the detection and estimation of each pair of change-points. The accuracy of the obtained change-point estimates is assessed. Proposed methods offer simultaneous control of the familywise false alarm and false re-adjustment rates at the pre-chosen levels.
Keywords: CUSUM process; Change-point problem; false alarm; maximum likelihood estimate; transient changes.
© 2023 Informa UK Limited, trading as Taylor & Francis Group.
Conflict of interest statement
No potential conflict of interest was reported by the author(s).
Figures
References
-
- Abd-Elnaser S., Rabou A.S., and Gad A.M., Change-point rank tests with epidemic alternatives, Egypt. Stat. J. 50 (2006), pp. 114–135.
-
- Baron M., Sequential methods for multistate processes, in Applied Sequential Methodologies, N. Mukhopadhyay, S. Datta, and S. Chattopadhyay, eds., Dekker, New York, 2004, pp. 55–73.
-
- Baron M. and Granott N., Consistent estimation of early and frequent change points, in Foundations of Statistical Inference, J. Haitovsky, H. R. Lerche, and Y. Ritov, eds., Physica-Verlag, Heidelberg, New York, 2003, pp. 181–194.
-
- Baron M., Rosenberg M., and Sidorenko N., Electricity pricing: Modeling and prediction with automatic spike detection, Energy, Power Risk Management 2001 (2001), pp. 36–39.
LinkOut - more resources
Full Text Sources