[Preprint]. 2025 May 13:2023.08.31.555748.
doi: 10.1101/2023.08.31.555748.

Bacterial cell wall biosynthesis is controlled by growth rate dependent modulation of turgor pressure in E. coli

Affiliations

Bacterial cell wall biosynthesis is controlled by growth rate dependent modulation of turgor pressure in E. coli

Avik Mukherjee et al. bioRxiv. .

Abstract

The cell wall is an essential cellular component of bacteria and the target of many antibiotics. However, how bacteria regulate the rate of cell wall biosynthesis as growth rates change remains unresolved. In E. coli, cell wall growth was thought to proceed independently from turgor pressure1, the osmotic pressure that the cytoplasm exerts on the cell wall. Here, we uncover a striking increase of turgor pressure with growth rate. Modulating turgor pressure and measuring cell wall biosynthesis, we find that turgor pressure is directly controls the rate of cell wall biosynthesis. The picture that emerges is that turgor pressure is largely generated by counterions of negatively charged cellular biomass. The increase in turgor pressure with growth rates results from more ribosomes and therefore higher concentrations of negatively charged ribosomal RNA. Elegantly, the coupling between biomass composition, turgor pressure and cell wall biosynthesis simultaneously explains how bacteria achieve homeostasis of cytoplasmic crowding and how they regulate the rate of cell wall biosynthesis across growth rates.


Figures

Figure 1:
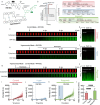
Figure 1:. Turgor pressure increases with growth rate.
a, Osmotic shocks put cells into plasmolysis, a state where the cytoplasm is retracted from the cell wall and osmotic pressure of the cytoplasm is balanced by externally applied osmolarity. b, In a microfluidic device, we measured the change in volume of the cytoplasm of hundreds of bacteria after applying osmotic shocks sufficient to induce plasmolysis. c, Cytoplasmic volume ratio in the EZRDM glucose condition as a function of inverse of the magnitude of the applied osmotic shock to determine turgor pressure. d, Inferred turgor pressure as a function of growth rate. Fits to the Boyle-van’t Hoff equation underlying these data from osmotic shocks of different magnitude are presented in Fig. S1d–l. Error bars represent uncertainty of the fit of the slope to the data in Fig. S1. Growth rates are measured from the same samples that are taken for turgor pressure measurement (See Fig. S1c).
Figure 2:
Figure 2:. Turgor pressure modulates the rate of cell wall biosynthesis.
a, Rf470DL 5are D-amino acids that become fluorescent after integration into the cell wall. b, Using a microfluidic device, we shifted E. coli to medium containing Rf470DL, as well as different media osmolarity. We quantified fluorescence intensity per cell wall length to quantify the rate of cell wall biosynthesis. c, An example control cell shifted to identical medium with Rf470DL. d, Kymograph of fluorescence intensity of different control cells. e, An example cell, shifted to hyperosmotic medium that induced plasmolysis. f, Kymograph of fluorescence intensity of different bacyteria in plasmolysis in hyperosmotic medium. g, An example cell, shifted back to normal osmolarity after being kept in plasmolysis for 5min. h, Kymograph of fluorescence intensity of different bacteria shifted back to normal medium after 5min in plasmolysis. i, Fluorescence intensity per cell wall length as a function of time for control cells. j, Fluorescence intensity per cell wall length as a function of time for cells in plasmolysis in hyperosmotic medium. k, Fluorescence intensity per cell wall length as a function of time for cells shifted back to normal osmolarity after 5min in plasmolysis. l, Rate of cell wall biosynthesis quantified from the slope of the traces in i-k.
Fig. 3:
Fig. 3:. Turgor pressure affects biomass density homeostasis.
a, We hypothesized that the physiological role of the observed increase in turgor pressure with growth rate in Fig. 1 is to coordinate growth rate of cell volume with growth rate of biomass. b, A linear increase of turgor pressure with growth rate ensures that biomass density remains constant across growth rates. c, Quantitative phase microscopy measurements show that biomass density is indeed remarkably constant across a wide range of growth conditions. Data for rich defined media is shown in Fig. S7. Growth rates are averages of biological replicates. Error bars in growth rate are the standard deviation from these biological replicates. Plotted dry mass density values result from averaging mean dry mass densities for the measured cell population from different biological replicates. Error bars in dry mass density were determined by propagating the standard deviations of the single cell distributions of the different measurements (Acetate: 3 measurements from n=3 biological replicates; Glucose: 5 measurements from n=4 biological replicates; Glycerol: 6 measurements from n=6 biological replicates; Galactose: 1 measurement from 1 biological replicate; Maltose: 9 measurement from 7 biological replicates; Mannitol: 5 measurements from n=4 biological replicates; Xylose: 3 measurements from n=3 biological replicates; Chemostat conditions: 2 measurements from 2 biological replicates for each data point). Carbon line represents the average dry mass density of different carbon conditions shown in this panel except chemostat experiments c, Cells become dense and growth rates slow down when grown in hyperosmotic media that reduce turgor pressure. Individual biological replicates plotted. Error bars are the standard deviation of the single cell distribution of the biological replicate. d, Reducing turgor pressure by titration of intracellular glutamate results in higher biomass density and slower growth, similar to the effect of external osmolarity. Individual experiments for different induction levels and biological replicates were binned by their measured growth rate (increments of 0.05/Hr). Error bars were determined by propagating the standard deviation of the single cell distributions from the individual experiments in each bin.
Figure 4:
Figure 4:. Turgor is modulated by ribosomal counterions to control cell wall expansion.
a, Schematic illustration of major cellular osmolytes. Potassium and glutamate contribute most to osmotic pressure, whereas the direct contribution from biomass is relatively minor. b, Intracellular potassium measured using inductively coupled plasma mass spectrometry (ICP-MS) in low potassium medium in different growth condition. Each data point is determined from several measurements along the growth curve (see Fig. S8 for individual measurements, two biological replicates for each condition). Note that potassium diffuses out of the cell during the mandatory washing step with potassium free medium. Therefore, we plot only relative changes of intracellular potassium across conditions. Error bars represent uncertainty of the fit in Fig. S8. c, RNA/protein ratio changes with growth rate according to growth laws. We converted RNA/protein measurements, including error bars, from Scott et al. to charge concentrations using total protein and total dry mass measurements from Basan et al. (see Fig. S8j,k), as well as dry mass density measurements from this work. d, Illustration of the mechano-electro-osmotic model adapted from mammalian cells for bacteria. For simplicity, we assume expression of a constant proteome fraction of potassium importers, a constant proteome fraction of exporters of all other ions, as well as a constant proteome fraction of passive ion channels. e, Numerical solution of the mechano-electro-osmotic model. Predicted turgor pressure is plotted against intracellular charge concentration. There is a baseline of negative charge concentration due to the net charge or protein, glutamate and a growth rate independent baseline level of RNA/DNA (see panel c). In addition, with increasing growth rate there is a linear increase of RNA from ribosomal RNA, as shown in panel c (and DNA from multiple replication forks). Hence, the charge concentration is a proxy from growth rate. f, Biomass density increases continuously with overexpression of more positively charged proteins demonstrating the central role of charge balance for biomass density homeostasis. RNA carries one negative charge per nucleotide, whereas proteins are much less negatively charged. Biomass density increases with protein overexpression and the magnitude of this increase depends on net protein charge. Conversely, sublethal doses of chloramphenicol result in higher concentrations of ribosomal RNA and cause lower biomass density. Because these perturbations result in very long cells of irregular width, biomass densities were determined using Threshold Iterative Volume (TIV) method (see Fig. S9a and Materials and Methods). Biological replicates shown as individual data points. Error bars are standard deviations from these biological replicates. P-values: **: 0.0042; ****: <0.0001. f, Ribosomes constitute the central hub of growth control of biomass and the cell wall. They control biomass production rate but also cell wall expansion rate via turgor pressure generated by their counterions.
Figure 5:
Figure 5:. Perturbation of cell wall properties.
a, Titration of the abundance of cell wall endopeptidases affects the effective viscosity of the cell wall, resulting in a slower volume growth rate with lower expression levels. The model predicts that increasing cell wall viscosity must be compensated by a combination of growth rate, biomass density and cell width (see Supplementary Note 1, Eq. [S13]). b, Comparison of experimental data to model prediction. A non-zero y-intercept may emerge from the activity of other cell wall endopeptidases or leaky expression. Error bars are standard deviations of the values calculated from the mean of individual biological replicates. Biological replicates identical to panel C. c, Ampicillin affects the crosslinking density of the peptidoglycan network and thereby its elastic modulus. The elastic modulus of the cell wall is proportional to its effective viscosity and therefore controls volume growth rate. The model predicts a direct proportionality between biomass density and the elastic modulus of the cell (see Supplementary Note 1, Eq. [S10]). d, Sublethal doses of ampicillin resulted in decreasing biomass densities, while growth rate was unaffected. Error bars represent standard deviation of biomass density from the distribution cells measured in each experiment. e, A larger cell width results in higher cell wall tension and therefore a higher volume expansion rate. The model predicts that faster volume expansion rate due to higher cell width must be compensated by a drop in biomass density (see Supplementary Note 1, Eq. [S8]). f, Average biomass density of individual cells, binned by their inverse cell width drops with increasing width. The effect is amplified by inhibiting MreB using A22 and also holds when pooling data across different carbon sources (see Fig. S10d). Glucose bin increment: 0.05μm-1. A22 bin increment: 0.025μm-1. Shaded areas represent the standard deviation of the distribution of cells in each bin.
Box 1:
Box 1:. Endopeptidase mediated cell wall fluidization (top).
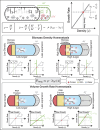
Cell wall endopeptidases (scissors) cleave longitudinal peptide bonds that limit cell wall expansion. This leads to expansion of the peptidoglycan network dependent on cell wall stress, generated by turgor pressure (middle panel), enabling insertion of new strands (red, right panel). Endopeptidases thus lead to stress-dependent expansion of cell wall network, resulting in stress relaxation. This constitutes a fluid-like rheology. Therefore, we model the cell wall as a Maxwell viscoelastic material, illustrated by the spring and damper in series. On short timescales such a material behaves like an elastic, whereas on long timescales it exhibits stress-dependent viscous flow that results in cell wall expansion. Model of cell volume expansion (bottom). The cell wall is modeled as a Maxwell viscoelastic material with a constitutive equation, given by Eq. [1]. Turgor pressure Pturg from the cytoplasm acts on the cross-section of the cell, generating a tension σ in the cell wall that is given by Eq. [2]. Combining Eq. [1] with Eq. [2] and integrating over the length of the cell, the model predicts a simple expression for volume growth rate, given by Eq. [3]. Model details and derivation of model predictions are presented in Supplementary Note 1, model parameters are summarized in Fig. S5.
Box 2:
Box 2:. Electro-osmotic model of ribosome-generated turgor pressure and homeostasis.
Top, Biomass density is determined by biomass growth rate and volume growth rates that must match in steady-state conditions. Because turgor pressure is proportional to biomass density, volume growth rate is also proportional to biomass density, according to Box 1, Eq. [3]. Middle: Illustration of dilute cells (left) and dense cells (right). Turgor pressure generated by counterions biomass results in turgor pressure proportional to biomass density (Eq. (4)). Higher biomass density then results in higher turgor pressure (Eq. (4)) and thereby faster cell volume expansion (Box 1, Eq. (3)). This creates a homeostatic feedback loop for control of biomass density. Bottom, Illustration of slow-growing cells (left) and fast-growing cells (right). Due to growth laws, a larger fraction of biomass is made up of ribosomes in fast-growing cells as compared to slow-growing cells (higher RNA/protein ratio). This results in a higher molarity of counterions per biomass. At constant total biomass density, faster growing cells have a higher counterion concentration and correspondingly a higher turgor pressure (Eq. (4)), as observed experimentally (Fig. 1c). Higher turgor thus results in faster cell volume expansion (Box 1, Eq. (3)), as required for maintaining constant biomass density across growth rates (see Fig. 3c & Eq. (S5)).

Similar articles

References

    1. Rojas E., Theriot J. A. & Huang K. C. Response of Escherichia coli growth rate to osmotic shock. Proc Natl Acad Sci U S A 111, 7807–7812 (2014). - PMC - PubMed
    1. Rojas E. R. & Huang K. C. Regulation of microbial growth by turgor pressure. Curr Opin Microbiol 42, 62–70 (2018). - PubMed
    1. Mukherjee A. et al. Membrane potential mediates the cellular response to mechanical pressure. Preprint at 10.1101/2023.11.02.565386 (2023). - DOI
    1. Wong F. et al. Mechanical strain sensing implicated in cell shape recovery in Escherichia coli. Nat Microbiol 2, 17115 (2017). - PMC - PubMed
    1. Hsu Y.-P. et al. Fluorogenic d-amino acids enable real-time monitoring of peptidoglycan biosynthesis and high-throughput transpeptidation assays. Nat Chem 11, 335–341 (2019). - PMC - PubMed

Publication types