[Preprint]. 2023 Sep 30:2023.09.28.559981.
doi: 10.1101/2023.09.28.559981.

AMPK Regulates Phagophore-to-Autophagosome Maturation

Affiliations

AMPK Regulates Phagophore-to-Autophagosome Maturation

Carlo Barnaba et al. bioRxiv. .

Update in

Abstract

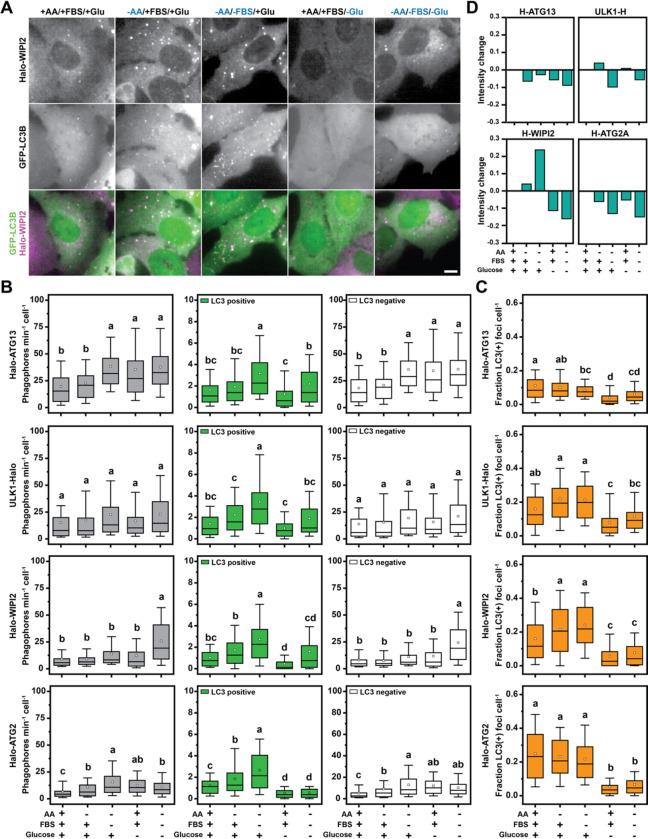
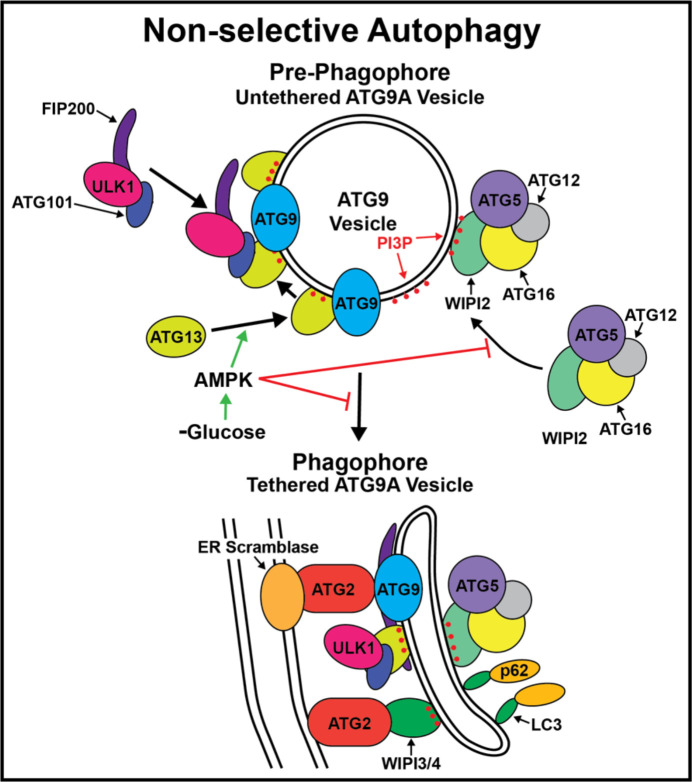
Autophagy is an important metabolic pathway that can non-selectively recycle cellular material or lead to targeted degradation of protein aggregates or damaged organelles. Autophagosome formation starts with autophagy factors accumulating on lipid vesicles containing ATG9. These phagophores attach to donor membranes, expand via ATG2-mediated lipid transfer, capture cargo, and mature into autophagosomes, ultimately fusing with lysosomes for their degradation. Autophagy can be activated by nutrient stress, for example by a reduction in the cellular levels of amino acids. In contrast, how autophagy is regulated by low cellular ATP levels via the AMP-activated protein kinase (AMPK), an important therapeutic target, is less clear. Using live-cell imaging and an automated image analysis pipeline, we systematically dissect how nutrient starvation regulates autophagosome biogenesis. We demonstrate that glucose starvation downregulates autophagosome maturation by AMPK mediated inhibition of phagophores tethering to donor membranes. Our results clarify AMPK's regulatory role in autophagy and highlight its potential as a therapeutic target to reduce autophagy.


Figures

Figure 1.
Figure 1.. K-FOCUS: Live-cell high-throughput single-cell analysis of foci colocalization.
(A) Illustration of the analysis pipeline for the Cellpose-TrackIt module, which incorporates CellPose segmentation into TrackIt (scale bar = 10 μm). (B) Workflow for manual ROI quality control and foci tracking using the TrackIt GUI. (C) A schematic outlining the colocalization criteria, including user-defined inputs, and key outputs. Additionally, it presents a visual representation of a colocalized and non-colocalized track, along with a kernel density plot of track length per cell for both colocalized and non-colocalized tracks.
Figure 2.
Figure 2.. K-FOCUS is a robust object-based colocalization tool in live-cell imaging.
(A) Example images demonstrating the accumulation of Halo-ATG9A in lysosomes, captured immediately after or 24 hours following labeling with JFX650 in U2OS cells (scale bar = 10 μm). (B) A comparison between different colocalization analysis methods for the data shown in (A), including Threshold-based Pearson and Manders coefficients, as well as wavelet spot detection-based SODA and K-FOCUS. The box indicates the interquartile range, the whiskers the 10–90% confidence interval, the square indicates the average, and the horizontal line is the median. (C) Example images of U2OS cells expressing GFP-LC3B and Halo-ATG13 under both control and EBSS conditions (scale bar = 5 μm). (D) A comparison between different colocalization analysis methods for the data shown in (C), including Threshold-based Pearson and Manders coefficients, as well as wavelet spot detection-based SODA and K-FOCUS analyses. The box indicates the interquartile range, the whiskers the 10–90% confidence interval, the square indicates the average, and the horizontal line is the median.
Figure 3.
Figure 3.. K-FOCUS analysis of the kinetics of autophagy factor foci formation under nutrient starvation.
(A) Live-Cell images of Halo-WIPI2 and GFP-LC3B in control and starvation medium (scale bar = 5 μm). (B) Quantification of colocalization kinetics of single cells in (A) and (Fig. S1) using K-FOCUS including total, colocalized, and non-colocalized phagophore formation rates. (C) Quantified fractions of LC3+ foci/cell from imaging in (A) and Fig.S1. For (B) and (C) the box indicates the interquartile range, the whiskers the 10–90% confidence interval, the square indicates the average, and the horizontal line is the median. (D) Intensity quantification of autophagy proteins from (A) and Fig. S1, including Halo-ATG13, Halo-ATG2A, Halo-WIPI2, and ULK1-Halo.
Figure 4.
Figure 4.. AMPK activation inhibits autophagosome maturation.
(A) Formation rate and conversion ratio of LC3 positive and LC3 negative foci formed by Halo-ATG13, ULK1-Halo, Halo-WIPI2, and Halo-ATG2A in glucose containing media in the absence and presence of the AMPK agonist MK8722. (B) Formation rate and conversion ratio of LC3 positive and LC3 negative foci formed by Halo-ATG13, ULK1-Halo, Halo-WIPI2, and Halo-ATG2A in media containing no glucose in the absence and presence of the AMPK inhibitor BAY3827. (C) Lifetimes of foci formed by by Halo-ATG13, ULK1-Halo, Halo-WIPI2, and Halo-ATG2A before and during co-localization with GFP-LC3B in glucose containing media in the presence and absence of the AMPK agonist MK8722 (left panels) or in media lacking glucose in in the absence and presence of the AMPK inhibitor BAY3827 (right panels). For all plots the box indicates the interquartile range, the whiskers the 10–90% confidence interval, the square indicates the average, and the horizontal line is the median.
Figure 5.
Figure 5.. Contribution of the ULK1 complex to starvation induced autophagy protein foci formation.
(A) Formation rate of total, LC3B positive, and LC3B negative Halo-ATG13 foci in control, ULK1, FIP200, and ATG101 knock out cells in various media conditions. (B) Lifetimes of LCB3 positive and LC3B negative Halo-ATG13 foci in control, ULK1, FIP200, and ATG101 knock out cells in various media conditions.
Figure 6.
Figure 6.. AMPK regulates tethering of WIPI2 positive phagophores.
(A) Model depicting the diffusion properties of tethered phagophores and untethered ATG9 vesicles. (B-C) Step size distributions of Halo-ATG13, ULK1-Halo, Halo-WIPI2, and Halo-ATG2A trajectories for (B) LC3B positive and (C) LC3B negative autophagy factor foci. (D) Kernel density plots of the step size distributions of Halo-ATG13, ULK1-Halo, Halo-WIPI2, and Halo-ATG2A trajectories for LC3B positive and negative tracks in the indicated media conditions. (E) Step size distributions of LC3B positive and negative Halo-WIPI2 trajectories fit with a two-state diffusion model (black line) encompassing tethered (red) and untethered (blue) populations in the different media conditions. (F) Diffusion coefficients of the tethered and untethered populations of LC3B positive and negative Halo-WIPI2 trajectories in the different media conditions, derived from the fits shown in Fig. 6E. (G) Distribution of LC3B positive and negative Halo-WIPI2 trajectories between tethered and untethered populations, derived from the fits shown in Fig. 6E.
Figure 7.
Figure 7.. Model of the regulation of autophagosome biogenesis by AMPK.
Glucose withdrawal leads to AMPK activation, which promotes the recruitment of ATG13 to mobile ATG9 vesicles. Under these conditions WIPI2 also accumulates on ATG9 vesicles but their tethering to donor membranes to allow phagophore maturation is inhibited by AMPK activation.

References

    1. Dikic I. & Elazar Z. Mechanism and medical implications of mammalian autophagy. Nature reviews Molecular cell biology 19, 349–364 (2018). - PubMed
    1. He C. & Klionsky D. J. Regulation mechanisms and signaling pathways of autophagy. Annual review of genetics 43, 67–93 (2009). - PMC - PubMed
    1. Melia T. J. Growing thin—How bulk lipid transport drives expansion of the autophagosome membrane but not of its lumen. Current Opinion in Cell Biology 83, 102190 (2023). - PMC - PubMed
    1. Lamb C. A., Yoshimori T. & Tooze S. A. The autophagosome: origins unknown, biogenesis complex. Nature reviews Molecular cell biology 14, 759–774 (2013). - PubMed
    1. Kinsey C. G. et al. Protective autophagy elicited by RAF→ MEK→ ERK inhibition suggests a treatment strategy for RAS-driven cancers. Nature medicine 25, 620–620 (2019). - PMC - PubMed

Publication types